Main Page

From PyMOLWiki
Revision as of 14:20, 20 September 2017 by Speleo3 (talk | contribs) (PyMOL v2.0)
Jump to navigation Jump to search
hosted by SBGridlogo2.jpg
Welcome to the PyMOL Wiki!
The community-run support site for the PyMOL molecular viewer.
To request a new account, email SBGrid at: accounts (@) sbgrid dot org
Quick Links
Tutorials Table of Contents Commands
Script Library Plugins FAQ
Gallery | Covers PyMOL Cheat Sheet (PDF) Getting Help
News & Updates
Official Release PyMOL v2.0 has been released on September 20, 2017.
Plugin Update MOLE 2.5 is an updated version of channel analysis software in PyMOL
Official Release PyMOL v1.8.6 has been released on March 9, 2017.
Official Release PyMOL v1.8.4 has been released on October 4, 2016.
New Script dssr_block is a wrapper for DSSR (3dna) and creates block-shaped nucleic acid cartoons
New Plugin LiSiCA is a new plugin for 2D and 3D ligand based virtual screening using a fast maximum clique algorithm.
Official Release PyMOL v1.8.0 has been released on Nov 18, 2015.
PyMOL Open-Source Fellowship Schrödinger is now accepting applications for the PyMOL Open-Source Fellowship program! Details on http://pymol.org/fellowship
Official Release PyMOL, AxPyMOL, and JyMOL v1.7.6 have all been released on May 4, 2015.
New Plugin PyANM is a new plugin for easier Anisotropic Network Model (ANM) building and visualising in PyMOL.
New Plugin Bondpack is a collection of PyMOL plugins for easy visualization of atomic bonds.
New Plugin MOLE 2.0 is a new plugin for rapid analysis of biomacromolecular channels in PyMOL.
3D using Geforce PyMOL can now be visualized in 3D using Nvidia GeForce video cards (series 400+) with 120Hz monitors and Nvidia 3D Vision, this was previously only possible with Quadro video cards.
Older News See Older News.
Did you know...

Volume

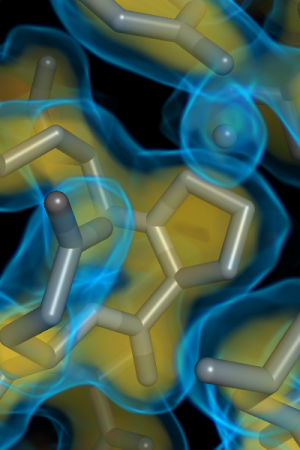
Volume visualization of electron density for PDB 1oky
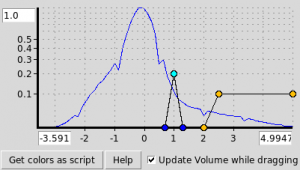
Volume panel for the 1oky volume example. It has the iso-levels on the x-axis and the opacity (1.0 - transparency) on the y-axis.


Volume creates a new volume object from a map object. The data (3D scalar fields) are shown as a true 3D object using coloring and transparencies defined by the user to illustrate the data values. This technique supports single and multiple isosurfaces.

Usage

volume name, map [, ramp [, selection [, buffer [, state [, carve ]]]]]

Arguments

  • name = the name for the new volume object.
  • map = the name of the map object to use for computing the volume.
  • ramp = str: named color ramp {default: }
  • selection = an atom selection about which to display the mesh with an additional "buffer" (if provided).
  • carve = a radius about each atom in the selection for which to include density. If "carve" is not provided, then the whole brick is displayed.

== ..→

A Random PyMOL-generated Cover. See Covers.