DynoPlot
| Type | PyMOL Plugin |
|---|---|
| Download | plugins/dynoplot.py |
| Author(s) | Dan Kulp |
| License | - |
| This code has been put under version control in the project Pymol-script-repo | |
Introduction
This script was setup to do generic plotting, that is given a set of data and axis labels it would create a plot. Initially, I had it setup to draw the plot directly in the PyMol window (allowing for both 2D and 3D style plots), but because I couldn't figure out how to billboard CGO objects (Warren told me at the time that it couldn't be done) I took a different approach. The plot now exists in it's own window and can only do 2D plots. It is however interactive. I only have here a Rama.(phi,psi) plot, but the code can be easily extended to other types of data. For instance, I had this working for an energy vs distance data that I had generated by another script.
This script will create a Phi vs Psi(Ramachandran) plot of the selection given. The plot will display data points which can be dragged around Phi,Psi space with the corresponding residue's Phi,Psi angles changing in the structure (PyMol window).
IMAGES
-
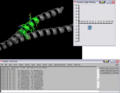 Initial Ramachandran plot of 1ENV
 -
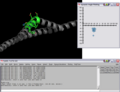 Modified pose and plot of 1ENV


SETUP
Install from the plugins menu with Plugin > Manage Plugins > Install ... or just run the script.
NOTES / STATUS
- Tested on Linux, PyMol version 1.4
- Left, Right mouse buttons do different things; Right = identify data point, Left = drag data point around
- Post comments/questions or send them to: dwkulp@mail.med.upenn.edu
USAGE
rama [ sel [, name [, symbols [, filename ]]]]
EXAMPLES
fetch 1ENV, async=0 # (download it or use the PDB loader plugin)
select sel01, resi 129-136
rama sel01
rock   # the object needs to be moving in order for the angles to be updated.
Don't create callback object, use symbols by secondary structure and dump canvas as postscript file:
fetch 2x19, async=0
color yellow, chain A
color forest, chain B
rama polymer, none, ss, /tmp/canvasdump.ps
rama ss H,    none, aa, /tmp/canvasdump_helix.ps
rama ss S,    none, aa, /tmp/canvasdump_sheet.ps