Forster distance calculator: Difference between revisions
No edit summary |
|||
| Line 7: | Line 7: | ||
This script does no calculation of proteins in pymol, but is made as a "hack/shortcut" for a python script. <br /> | This script does no calculation of proteins in pymol, but is made as a "hack/shortcut" for a python script. <br /> | ||
We use the python part of pymol to do the calculations, so a student would not need to install python at home, but simply pymol. | We use the python part of pymol to do the calculations, so a student would not need to install python at home, but simply pymol. <br /> | ||
Make a pymol .pml file like this. Write in the required information, and execute/run the script with pymol. Then open the .plt file afterwards with gnuplot. | |||
<source lang="python"> | |||
## Change to your directory | |||
cd /homes/YOU/Documents/Atto-dyes/Spectre/ALEXA488-ALEXA633 | |||
import forster | |||
forster D_Exi=ALEXA488Exi.txt, D_Emi=ALEXA488Emi.txt, A_Exi=ALEXA633Exi.txt, A_Emi=ALEXA633Emi.txt, A_e_Max_Y=159000, A_e_Max_X=621, Qd=0.92 | |||
</source> | |||
== Spectre input == | == Spectre input == | ||
| Line 80: | Line 86: | ||
Gnuplot makes three graphs in .eps format. They can be converted to pdf with the program: epstopdf or eps2pdf. They are for example part of LaTeX: C:\Program Files (x86)\MiKTeX 2.9\miktex\bin or you can [http://tinyurl.com/eps2pdf download it here]. | Gnuplot makes three graphs in .eps format. They can be converted to pdf with the program: epstopdf or eps2pdf. They are for example part of LaTeX: C:\Program Files (x86)\MiKTeX 2.9\miktex\bin or you can [http://tinyurl.com/eps2pdf download it here]. | ||
<gallery heights="240px" widths="340px"> | <gallery heights="240px" widths="340px"> | ||
Image:1-ALEXA488Emi-ALEXA633Exi-overlap-all-spectre.png|All graphs plotted together, but not scaled correctly. | Image:1-ALEXA488Emi-ALEXA633Exi-overlap-all-spectre.png|All graphs plotted together, but not scaled correctly. | ||
| Line 86: | Line 91: | ||
Image:3-ALEXA488Emi-ALEXA633Exi-overlap-integral.png|The Rectangle integral datapoint (y1) and the summed integration (y2). | Image:3-ALEXA488Emi-ALEXA633Exi-overlap-integral.png|The Rectangle integral datapoint (y1) and the summed integration (y2). | ||
</gallery> | </gallery> | ||
== How to run the script == | |||
Make a pymol .pml file like this. Write in the required information, and execute/run the script with pymol. Then open the .plt file afterwards with pymol. | |||
<source lang="python"> | |||
## Change to your directory | |||
cd /homes/YOU/Documents/Atto-dyes/Spectre/ALEXA488-ALEXA633 | |||
import forster | |||
forster D_Exi=ALEXA488Exi.txt, D_Emi=ALEXA488Emi.txt, A_Exi=ALEXA633Exi.txt, A_Emi=ALEXA633Emi.txt, A_e_Max_Y=159000, A_e_Max_X=621, Qd=0.92 | |||
</source> | |||
== Python Code: forster.py == | |||
The code can be downloaded fast from here http://tinyurl.com/pymolforster <br /> | |||
# wget http://tinyurl.com/pymolforster | |||
# mv pymolforster forster.py | |||
<source lang="python"> | |||
try: from pymol import cmd; runningpymol='yes' | |||
except: runningpymol='no'; pass | |||
import os, platform, math | |||
#------------------------------------------------------------------------------- | |||
# Name: Forster | |||
# Purpose: Forster resonance energy transfer calculator. | |||
# Input is manufactor provided spectres of Donor emission and | |||
# acceptor excitation spectrum. | |||
# | |||
# Carl Boswell and co. have made a new homepage with a long list of dyes which can be downloaded. | |||
# With a graphics program, they have traced several spectre of dyes from the literature and made this easily public at: | |||
# http://www.spectra.arizona.edu/ I highly recommend this homepage. | |||
# With these Spectra, the script can calculate the Forster Distance for different dyes from different companies. | |||
# Download "one spectrum at the time" by "deselecting" one of the spectre in the right side of the graph window. | |||
# Then get the datafile with the button in the lower right corner. | |||
## | |||
# Made from | |||
# http://en.wikipedia.org/wiki/F%C3%B6rster_resonance_energy_transfer#Theoretical_basis | |||
# {R_0}^6 = \frac{9\,Q_0 \,(\ln 10) \kappa^2 \, J}{128 \, \pi^5 \,n^4 \, N_A} | |||
# | |||
# Author: Troels Emtekaer Linnet: tlinnet@gmail.com | |||
# | |||
# Created: 29/03/2011 | |||
# Copyright: (c) tlinnet 2011 | |||
# Licence: Free for all | |||
#------------------------------------------------------------------------------- | |||
#Ref(1) | |||
# Biochemistry 1997, 36, 11261-11272 | |||
# M. Pilar Lillo, Joseph M. Beechem, Barbara K. Szpikowska, Mark A. Sherman, and Maria T. Mas | |||
#Design and Characterization of a Multisite Fluorescence Energy-Transfer System for Protein Folding Studies: A Steady-State and Time-Resolved Study of Yeast Phosphoglycerate Kinase | |||
# | |||
# NOTES: | |||
# Datafiles: Two column file. Space separated. Numbers are "." dot noted. First column is in nanometers nm. Second column is arbitrary units of fluorescence/emission. | |||
# If you have collected Donor Exitation and Acceptor Emission, they can be collected and plotted in gnuplot automatically. Set: Compare"yes" | |||
# xunit="nm": Enter x values in "nm" or "cm". | |||
# A_e_Max_Y : Acceptor maximum molar extinction coefficient. In units of M-1 cm-1. Approx 60000 - 1500000 | |||
# A_e_Max_X : Enter at which wavelength (in nm) the maximum absorption occurs. | |||
# Qd=0.8 : Fluorescence quantum yield of the donor in the absence of the acceptor. Qd = neta_fl = n_fl / n_abs = n_emi / n_exi | |||
# k2 = 2.0/3.0 Dipole orientation factor. | |||
# n = 1.33 : Refractive index of the medium. water=1.33, protein=1.4, n2MGuHCl=1.375 Ref(1) | |||
# NA = 6.02214179e+023 # (units: Number*mol-1 )Avogadros number | |||
def forster(D_Exi="ATTO488Exi.txt",D_Emi="ATTO488Emi.txt",A_Exi="ATTO590Exi.txt",A_Emi="ATTO590Emi.txt",A_e_Max_Y=120000,A_e_Max_X=594,Qd=0.8,k2=0.66667,n=1.33,Compare="yes",xunit="nm"): | |||
A_e_Max_Y=float(A_e_Max_Y);A_e_Max_X=float(A_e_Max_X);Qd=float(Qd);k2=float(k2);n=float(n);NA=6.02214179e+023 | |||
print k2, Qd | |||
printAll = "ye" # To print out all info | |||
fileDexi, extDexi = os.path.splitext(D_Exi) | |||
fileDemi, extDemi = os.path.splitext(D_Emi) | |||
fileAexi, extAexi = os.path.splitext(A_Exi) | |||
fileAemi, extAemi = os.path.splitext(A_Emi) | |||
overlapname = fileDemi+"-"+fileAexi+"-overlap.dat" | |||
overlapfile = open(overlapname, "w") | |||
overlapgnuplotname = fileDemi+"-"+fileAexi+"-overlap.plt" | |||
overlapgnuplotfile = open(overlapgnuplotname, "w") | |||
print "\nI have opened two files for you: \n%s and %s" % (overlapname,overlapgnuplotname) | |||
print "The .plt should be opened with gnuplot to make the graphs." | |||
print "The created graphs are .eps files." | |||
print "They can be converted to pdf with the program: epstopdf or eps2pdf" | |||
print 'Part of LaTeX: C:\Program Files (x86)\MiKTeX 2.9\miktex'+"\\"+"bin" | |||
print "Or download here: http://tinyurl.com/eps2pdf" | |||
DonorEmi = open(D_Emi, "r") | |||
AcceptorExi = open(A_Exi, "r") | |||
lineDemi = DonorEmi.readlines() | |||
lineAexi = AcceptorExi.readlines() | |||
Demi = [] | |||
Aexi = [] | |||
for i in lineDemi: | |||
if not i.strip(): #If line cannot get stripped(does not exist), then continue | |||
continue | |||
else: #If line can get stripped | |||
if testfloat(str.split(i)[0]): | |||
Demi.append([float(str.split(i)[0]), float(str.split(i)[1])]) | |||
AreaDemi = numintegrator(Demi) | |||
print "Nummerical integration of Donor emission spectrum, used for normalization, gives: Area=",AreaDemi | |||
for i in lineAexi: | |||
if not i.strip(): | |||
continue | |||
else: | |||
if testfloat(str.split(i)[0]): | |||
Aexi.append([float(str.split(i)[0]), float(str.split(i)[1])]) | |||
if float(str.split(i)[0]) == float(A_e_Max_X): | |||
Epsiloncorrection = [float(A_e_Max_X), float(str.split(i)[0]), float(str.split(i)[1])] | |||
# Making the overlap | |||
OverlapDataPoints = [] | |||
OverlapSum = 0.0 | |||
# For comparing two floating numbers, one have to be carefully. Setting error allowing difference | |||
eallow = 0.00000001 | |||
for i in range(len(Demi)): | |||
for j in range(len(Aexi)): | |||
if Demi[i][0]-eallow < Aexi[j][0] and Demi[i][0]+eallow > Aexi[j][0]: | |||
Overlap = (Demi[i][1]*Aexi[j][1]*float(A_e_Max_Y)*math.pow(Demi[i][0],4))/(AreaDemi*Epsiloncorrection[2]) | |||
OverlapSum = OverlapSum + Overlap | |||
OverlapDataPoints.append([Demi[i][0], Demi[i][1], Aexi[j][0], Aexi[j][1], Overlap, OverlapSum]) | |||
AreaOverlap = numintegrator(OverlapDataPoints,0,4) | |||
Prefactor = ForsterPrefactor6(Qd,k2,n,NA,printAll) | |||
ForsterAng = ForsterCalc(Prefactor,AreaOverlap,xunit,printAll) | |||
# Outputting data | |||
overlapfile.write("Emi-wavelength Emi-value-norm1 Emi-value-normA Exi-wavelength Exi-value-norm1 Exti-coefficient Overlap Overlap-Sum\n"); | |||
for line in range(len(OverlapDataPoints)): | |||
textline = "%4.1f %24.4f %15.4e %14.1f %15.4e %16.4e %12.4e %13.4e"%(OverlapDataPoints[line][0],OverlapDataPoints[line][1],float(OverlapDataPoints[line][1]/AreaDemi),OverlapDataPoints[line][2],OverlapDataPoints[line][3],float(A_e_Max_Y*OverlapDataPoints[line][3]/Epsiloncorrection[2]),float(OverlapDataPoints[line][4]),float(OverlapDataPoints[line][5])) | |||
overlapfile.write(textline+"\n") | |||
#Make gnuplot plot file | |||
overlapgnuplotfile.write("reset" + "\n") | |||
overlapgnuplotfile.write("cd "+"'"+os.getcwd()+"'"+"\n") | |||
overlapgnuplotfile.write("\n") | |||
overlapgnuplotfile.write("set xrange [400:800]"+"\n") | |||
overlapgnuplotfile.write("set ytics nomirror"+"\n") | |||
overlapgnuplotfile.write("set y2tics"+"\n") | |||
if xunit == "cm": overlapgnuplotfile.write("set xlabel 'Wavelength (cm)'"+"\n") | |||
else: overlapgnuplotfile.write("set xlabel 'Wavelength (nm)'"+"\n") | |||
overlapgnuplotfile.write("set size ratio 0.5"+"\n") | |||
overlapgnuplotfile.write("\n") | |||
overlapgnuplotfile.write("A_e_Max_Y = "+str(A_e_Max_Y)+"\n") | |||
overlapgnuplotfile.write("A_e_Max_X = "+str(A_e_Max_X)+"\n") | |||
overlapgnuplotfile.write("AreaDemi = "+str(AreaDemi)+"\n") | |||
overlapgnuplotfile.write("AreaOverlap = "+str(AreaOverlap)+"\n") | |||
overlapgnuplotfile.write("ForsterAng= "+str(ForsterAng)+"\n") | |||
overlapgnuplotfile.write("\n") | |||
if Compare == "yes": | |||
overlapgnuplotfile.write("#########################Graph 1#############################"+"\n") | |||
overlapgnuplotfile.write('set title '+'"'+fileDemi+"-"+fileAexi+' FRET Donor/Acceptor spectre"'+"\n") | |||
overlapgnuplotfile.write('set ylabel "Donor Fluorescence Intensity F_{D}({/Symbol l}) \\n Acceptor Extinction coefficient {/Symbol e}({/Symbol l})"'+"\n") | |||
overlapgnuplotfile.write('set y2label "F_{D}({/Symbol l}){/Symbol e}({/Symbol l})^{norm1}{/Symbol l}^{4}"'+"\n") | |||
overlapgnuplotfile.write("\n") | |||
overlapgnuplotfile.write('set label 1 "Donor Emission Area= %g", AreaDemi at graph 0.7, -0.15'+"\n") | |||
overlapgnuplotfile.write("\n") | |||
overlapgnuplotfile.write('set term postscript eps enhanced color'+"\n") | |||
overlapgnuplotfile.write('set output '+'"1-'+fileDemi+"-"+fileAexi+'-overlap-all-spectre.eps"'+"\n") | |||
overlapgnuplotfile.write('plot '+'"'+fileDexi+extDexi+'" using 1:2 title '+'"'+fileDexi+' exitation" with lines,\\'+"\n") | |||
# overlapgnuplotfile.write('"'+overlapname+'" using 1:2 title '+'"'+fileDemi+' emission" with lines,\\'+"\n") | |||
# overlapgnuplotfile.write('"'+overlapname+'" using 4:5 title '+'"'+fileAexi+' exitation" with lines,\\'+"\n") | |||
overlapgnuplotfile.write('"'+fileDemi+extDemi+'" using 1:2 title '+'"'+fileDemi+' emission" with lines,\\'+"\n") | |||
overlapgnuplotfile.write('"'+fileAexi+extAexi+'" using 1:2 title '+'"'+fileAexi+' exitation" with lines,\\'+"\n") | |||
overlapgnuplotfile.write('"'+fileAemi+extAemi+'" using 1:2 title '+'"'+fileAemi+' emission" with lines,\\'+"\n") | |||
overlapgnuplotfile.write('"'+overlapname+'" using 1:($2*$5*$1**4) title "D/A Overlap :y2" with lines axis x1y2'+"\n") | |||
overlapgnuplotfile.write("\n") | |||
overlapgnuplotfile.write("## Show in window, x11 for Linux"+"\n") | |||
overlapgnuplotfile.write("#set term x11"+"\n") | |||
overlapgnuplotfile.write("#set term windows"+"\n") | |||
overlapgnuplotfile.write("#replot"+"\n") | |||
overlapgnuplotfile.write("#pause -1"+"\n") | |||
overlapgnuplotfile.write("unset label"+"\n") | |||
overlapgnuplotfile.write("\n") | |||
overlapgnuplotfile.write("#########################Graph 2#############################"+"\n") | |||
overlapgnuplotfile.write('set title '+'"'+fileDemi+"-"+fileAexi+' FRET Donor/Acceptor overlap"'+"\n") | |||
overlapgnuplotfile.write('set ylabel "Donor Fluorescence Intensity \\n Normalized by F_{D}({/Symbol l})^{normA}=F_{D}({/Symbol l})/F_{Area}"'+"\n") | |||
overlapgnuplotfile.write('set y2label "Acceptor Extinction coefficient [M^{-1}cm^{-1}] \\n Normalized to {/Symbol e}({/Symbol l})"'+"\n") | |||
overlapgnuplotfile.write("\n") | |||
overlapgnuplotfile.write('set label 1 "{/Symbol e}(max)= %g", A_e_Max_Y at graph 0.63, 0.65'+"\n") | |||
overlapgnuplotfile.write('set label 2 "at %g '+xunit+'", A_e_Max_X at graph 0.63, 0.60'+"\n") | |||
overlapgnuplotfile.write("\n") | |||
overlapgnuplotfile.write('set term postscript eps enhanced color'+"\n") | |||
overlapgnuplotfile.write('set output '+'"2-'+fileDemi+"-"+fileAexi+'-overlap-normalized-spectre.eps"'+"\n") | |||
overlapgnuplotfile.write('plot '+'"'+overlapname+'" using 1:3 title '+'"'+fileDemi+', Normalized by area, emission" with lines,\\'+"\n") | |||
overlapgnuplotfile.write('"'+overlapname+'" using 4:6 title '+'"'+fileAexi+' Extinction coefficient :y2" with lines axis x1y2'+"\n") | |||
overlapgnuplotfile.write("\n") | |||
overlapgnuplotfile.write("## Show in window, x11 for Linux"+"\n") | |||
overlapgnuplotfile.write("#set term x11"+"\n") | |||
overlapgnuplotfile.write("#set term windows"+"\n") | |||
overlapgnuplotfile.write("#replot"+"\n") | |||
overlapgnuplotfile.write("#pause -1"+"\n") | |||
overlapgnuplotfile.write("unset label"+"\n") | |||
overlapgnuplotfile.write("\n") | |||
overlapgnuplotfile.write("#########################Graph 3#############################"+"\n") | |||
overlapgnuplotfile.write('set title '+'"'+fileDemi+"-"+fileAexi+' FRET Donor/Acceptor overlap integral"'+"\n") | |||
if xunit == "cm": | |||
overlapgnuplotfile.write('set ylabel "Donor/Acceptor overlap [cm^{3}M^{-1}] \\n F_{D}({/Symbol l})^{normA}{/Symbol e}({/Symbol l}){/Symbol l}^{4}"'+"\n") | |||
overlapgnuplotfile.write('set y2label "Donor/Acceptor overlap integral [cm^{3}M^{-1}] \\n {/Symbol S} F_{D}({/Symbol l})^{normA}{/Symbol e}({/Symbol l}){/Symbol l}^{4}"'+"\n") | |||
else: | |||
overlapgnuplotfile.write('set ylabel "Donor/Acceptor overlap [cm^{-1}nm^{4}M^{-1}] \\n F_{D}({/Symbol l})^{normA}{/Symbol e}({/Symbol l}){/Symbol l}^{4}"'+"\n") | |||
overlapgnuplotfile.write('set y2label "Donor/Acceptor overlap integral [cm^{-1}nm^{4}M^{-1}] \\n {/Symbol S} F_{D}({/Symbol l})^{normA}{/Symbol e}({/Symbol l}){/Symbol l}^{4}"'+"\n") | |||
overlapgnuplotfile.write("\n") | |||
overlapgnuplotfile.write('set label 1 "Overlap integral:" at graph 0.55, 0.65'+"\n") | |||
overlapgnuplotfile.write('set label 2 "{/Symbol S}= %g", AreaOverlap at graph 0.55, 0.60'+"\n") | |||
overlapgnuplotfile.write('set label 3 "Forster Distance:" at graph 0.55, 0.50'+"\n") | |||
overlapgnuplotfile.write('set label 5 "R_{0}= %g Angstrom", ForsterAng at graph 0.55, 0.45'+"\n") | |||
overlapgnuplotfile.write("\n") | |||
overlapgnuplotfile.write('set term postscript eps enhanced color'+"\n") | |||
overlapgnuplotfile.write('set output '+'"3-'+fileDemi+"-"+fileAexi+'-overlap-integral.eps"'+"\n") | |||
overlapgnuplotfile.write('plot '+'"'+overlapname+'" using 1:7 title "Overlap: F_{D}({/Symbol l})^{normA}{/Symbol e}({/Symbol l}) {/Symbol l}^{4}" with lines,\\'+"\n") | |||
overlapgnuplotfile.write('"'+overlapname+'" using 1:8 title "Integral: {/Symbol S} F_{D}({/Symbol l})^{normA} {/Symbol e}({/Symbol l}){/Symbol l}^{4} :y2" with lines axis x1y2'+"\n") | |||
overlapgnuplotfile.write("\n") | |||
overlapgnuplotfile.write("## Show in window, x11 for Linux"+"\n") | |||
overlapgnuplotfile.write("#set term x11"+"\n") | |||
overlapgnuplotfile.write("#set term windows"+"\n") | |||
overlapgnuplotfile.write("#replot"+"\n") | |||
overlapgnuplotfile.write("#pause -1"+"\n") | |||
overlapgnuplotfile.write("unset label") | |||
overlapgnuplotfile.close() | |||
overlapfile.close() | |||
return(ForsterAng) | |||
if runningpymol !='no': cmd.extend("forster",forster) | |||
def ForsterConstFactor6(NA,printAll): | |||
vForsterConstFactor6 = (9*math.log(10))/(128*math.pow(math.pi,5)*NA) | |||
if printAll == 'yes': print "Forster constant pre-factor is:", str(vForsterConstFactor6), "(units: mol)" | |||
return vForsterConstFactor6 | |||
def ForsterVariableFactor6(Qd,k2,n,printAll): | |||
vForsterVariableFactor6 = (k2*Qd)/(math.pow(n,4)) | |||
if printAll == 'yes': print "Forster variable pre-factor is:", str(vForsterVariableFactor6), "(units: NIL)" | |||
return vForsterVariableFactor6 | |||
def ForsterPrefactor6(Qd,k2,n,NA,printAll): | |||
vForsterPrefactor6 = ForsterConstFactor6(NA,printAll)*ForsterVariableFactor6(Qd,k2,n,printAll) | |||
if printAll == 'yes': print "Forster pre-factor is:", str(vForsterPrefactor6), "(units: mol)" | |||
return vForsterPrefactor6 | |||
def ForsterCalcnm(fFPreFactor6, fAreaOverlap,printAll): | |||
if printAll == 'yes': print "Overlap sum is: ", str(fAreaOverlap), "(units: cm-1 nm^4 L mol-1)" | |||
Forster6 = fFPreFactor6*fAreaOverlap | |||
if printAll == 'yes': print "Forster distance 6th power:", str(Forster6), "(units: cm-1 nm^4 L), obs(1L=1e-3m^3)" | |||
Forster6m = Forster6*100*math.pow(1e-9,4)*1e-3 #1e-3 is conversion from 1L = 1e-3 m3 | |||
if printAll == 'yes': print "Forster distance 6th power:", str(Forster6m), "(units: meter m^6)" | |||
Forster6Ang = Forster6m*math.pow(1e10, 6.0) | |||
if printAll == 'yes': print "Forster distance Angstrom 6th power:", "%e" % (Forster6Ang), "(units: Angstrom^6)" | |||
ForsterAng = math.pow(Forster6Ang, 1.0/6.0) | |||
print "Forster distance:", str(ForsterAng), "(units: Angstrom)" | |||
return ForsterAng | |||
def ForsterCalccm(fFPreFactor6, fAreaOverlap,printAll): | |||
if printAll == 'yes': print "Overlap sum is: ", str(fAreaOverlap), "(units: cm^3 L mol-1)" | |||
Forster6 = fFPreFactor6*fAreaOverlap | |||
if printAll == 'yes': print "Forster distance 6th power:", str(Forster6), "(units: cm^3 L), obs(1L=1e-3m^3)" | |||
Forster6m = Forster6*math.pow(1e-2,3)*1e-3 #1e-3 is conversion from 1L = 1e-3 m3 | |||
if printAll == 'yes': print "Forster distance 6th power:", str(Forster6m), "(units: meter m^6)" | |||
Forster6cm = Forster6m*math.pow(1e2, 6.0) | |||
if printAll == 'yes': print "Forster distance cm 6th power:", "%e" % (Forster6cm), "(units: cm^6)" | |||
Forster6Ang = Forster6m*math.pow(1e10, 6.0) | |||
if printAll == 'yes': print "Forster distance Angstrom 6th power:", "%e" % (Forster6Ang), "(units: Angstrom^6)" | |||
ForsterAng = math.pow(Forster6m, 1.0/6.0) | |||
print "Forster distance:", str(ForsterAng), "(units: Angstrom)" | |||
return ForsterAng | |||
def ForsterCalc(fFPreFactor6, fAreaOverlap,xunit,printAll): | |||
if xunit == "nm": | |||
Value = ForsterCalcnm(fFPreFactor6, fAreaOverlap,printAll) | |||
if xunit == "cm": | |||
Value = ForsterCalccm(fFPreFactor6, fAreaOverlap,printAll) | |||
return Value | |||
def testfloat(x): | |||
try: | |||
v=float(x) | |||
return x | |||
except: | |||
return False | |||
def numintegrator(fluarray, col1=0, col2=1): | |||
xprev = 0; xpres = 0; yprev = 0; ypres = 0; summing = 0 | |||
for i in range(len(fluarray)): | |||
# Have to skip first datapoint | |||
if i > 0: | |||
xprev = xpres; yprev = ypres | |||
xpres = fluarray[i][col1]; ypres = fluarray[i][col2] | |||
summing = yprev*(xpres-xprev)+(ypres-yprev)*(xpres-xprev)/2.0 + summing | |||
else: | |||
xpres = fluarray[i][col1]; ypres = fluarray[i][col2] | |||
return summing | |||
</source> | |||
[[Category:Script_Library]] | [[Category:Script_Library]] | ||
[[Category:Biochemical_Scripts]] | [[Category:Biochemical_Scripts]] | ||
Revision as of 05:54, 24 August 2011
Author
This pymol script is made by Troels Emtekær Linnet
Introduction
This script can be handsome, if one is working with Förster resonance energy transfer in proteins. The script calculates the Förster distance: R0, from two dyes excitation/emission spectres.
This script is very handsome, if one want's to pick two dyes from different companies, and the Förster distance is not provided in a table.
This script does no calculation of proteins in pymol, but is made as a "hack/shortcut" for a python script.
We use the python part of pymol to do the calculations, so a student would not need to install python at home, but simply pymol.
Make a pymol .pml file like this. Write in the required information, and execute/run the script with pymol. Then open the .plt file afterwards with gnuplot.
## Change to your directory
cd /homes/YOU/Documents/Atto-dyes/Spectre/ALEXA488-ALEXA633
import forster
forster D_Exi=ALEXA488Exi.txt, D_Emi=ALEXA488Emi.txt, A_Exi=ALEXA633Exi.txt, A_Emi=ALEXA633Emi.txt, A_e_Max_Y=159000, A_e_Max_X=621, Qd=0.92
Spectre input
There should be provided the path to four datafiles:
Excitation and Emission spectre for the Donor dye: D_Exi="path.txt" D_Emi="path.txt
Excitation and Emission spectre for the Acceptor dye: A_Exi="path.txt" A_Emi="path.txt
Each of the files shall be a two column file. Separated by space. Numbers are "." dot noted and not by "," comma. One can for example prepare the files by search-and-replace in a small text editor.
The first column is the wavelength in nanometers "nm" or centimetres "cm". Second column is the arbitrary units of excitation/emission.
For example:
Absorption
Wavelength "Alexa Fluor 488 H2O (AB)"

300.00 0.1949100000
301.00 0.1991200000
302.00 0.2045100000
303.00 0.2078800000
....
Getting spectres
For example provides the company ATTO-TEC spectre for their dyes in excel format Spectre(excel-file). These can easily be copied from excel to a flat two column file.
Some of the most cited dyes are the Alexa Fluor dyes from the company invitrogen. Invitrogen does not provide spectres for their dyes in dataformat, but as flat picture files.
Luckily, a group on University of Arizona have traced several spectre of dyes from the literature with a graphics program. They have made these spectre easily public at http://www.spectra.arizona.edu/. I highly recommend this homepage.
With these Spectra, the script can calculate the Forster Distance for different dyes from different companies.
Download one spectrum at the time by "deselecting" in the right side of the graph window. Then get the datafile with the button in the lower right corner.
Input values
The calculation needs input for:
- Qd: Fluorescence quantum yield of the donor in the absence of the acceptor.
- This is normally provided from the manufacture, and this information is normally also available in the database.
- It is recognized in the literature, that the value for Qd, changes on behalf on which position its located on the protein.
- Changes in 5-10 % is normal, but much larger values can be expected if the dye make hydrophobic interactions with the protein. This is dye-nature dependant.
- This value can only be determined precisely with experiments for the protein at hand.
- But anyway, for a "starting" selection for a FRET pair, the manufacture Qd should be "ok".
- Kappa2 = 2.0/3.0: Dipole orientation factor.
- In the literature, I often see this equal 2/3=0,667 This corresponds for free diffusing dye.
- For a dye attached to a protein, and restricted in one direction, the value is equal Kappa2=0.476
- But since we take the 6th root of the value, the difference ends up only being 5% in relative difference for the R0 value.
- Kappa2=2/3 can be a valid fast approximation, for the purpose of ordering dyes. But be careful and check the literature for discussions.
- n = 1.33:
- water=1.33, protein=1.4, n(2M GuHCl)=1.375
- Again, we take the sixth root, so the differences are "not so important".
How the script works
- The script integrate the Donor emission spectre, to divide with it.
- This is done by simple numerical integration by the Rectangle method
- All datapoints for the Acceptor excitation spectre are scaled, so that e(molar extinction coefficient) fits the wavelength where it is determined.
- For the multiplication of the spectre, the script test that both data points exist before multiplication.
- This can be troublesome, if there is 1-2 nm between each data point. Or if they are "un-even". Like Donor has 100.2 100.4 100.4 and Acceptor has 100.1 100.3 100.5
- But most spectre have much better resolution. Mostly 0.2 nm, and "even spaced"
- So this should work quite good as well.
The output is a text file, with all the datapoints.
- Column: Donor: The input Emission wavelength.
- Column: Donor: The input Emission, arbitrary units of excitation.
- Column: Donor: The input Emission, arbitrary units of excitation, divided by the integrated area.
- Column: Acceptor: The input excitation wavelength.
- Column: Acceptor: The input excitation e(molar extinction coefficient).
- Column: Acceptor: The input excitation e(molar extinction coefficient), scaled correctly.
- Column: The calculated overlap for this datapoint.
- Column: The summed values for calculated overlap, until this datapoint.
It also automatically generates a gnuplot .plt file, for super fast making graphs of the spectres. In linux, gnuplot is normally part of the installation. Just write: gnuplot FILENAME.plt
If you are in windows, download gnuplot and open the .plt file.
Gnuplot makes three graphs in .eps format. They can be converted to pdf with the program: epstopdf or eps2pdf. They are for example part of LaTeX: C:\Program Files (x86)\MiKTeX 2.9\miktex\bin or you can download it here.
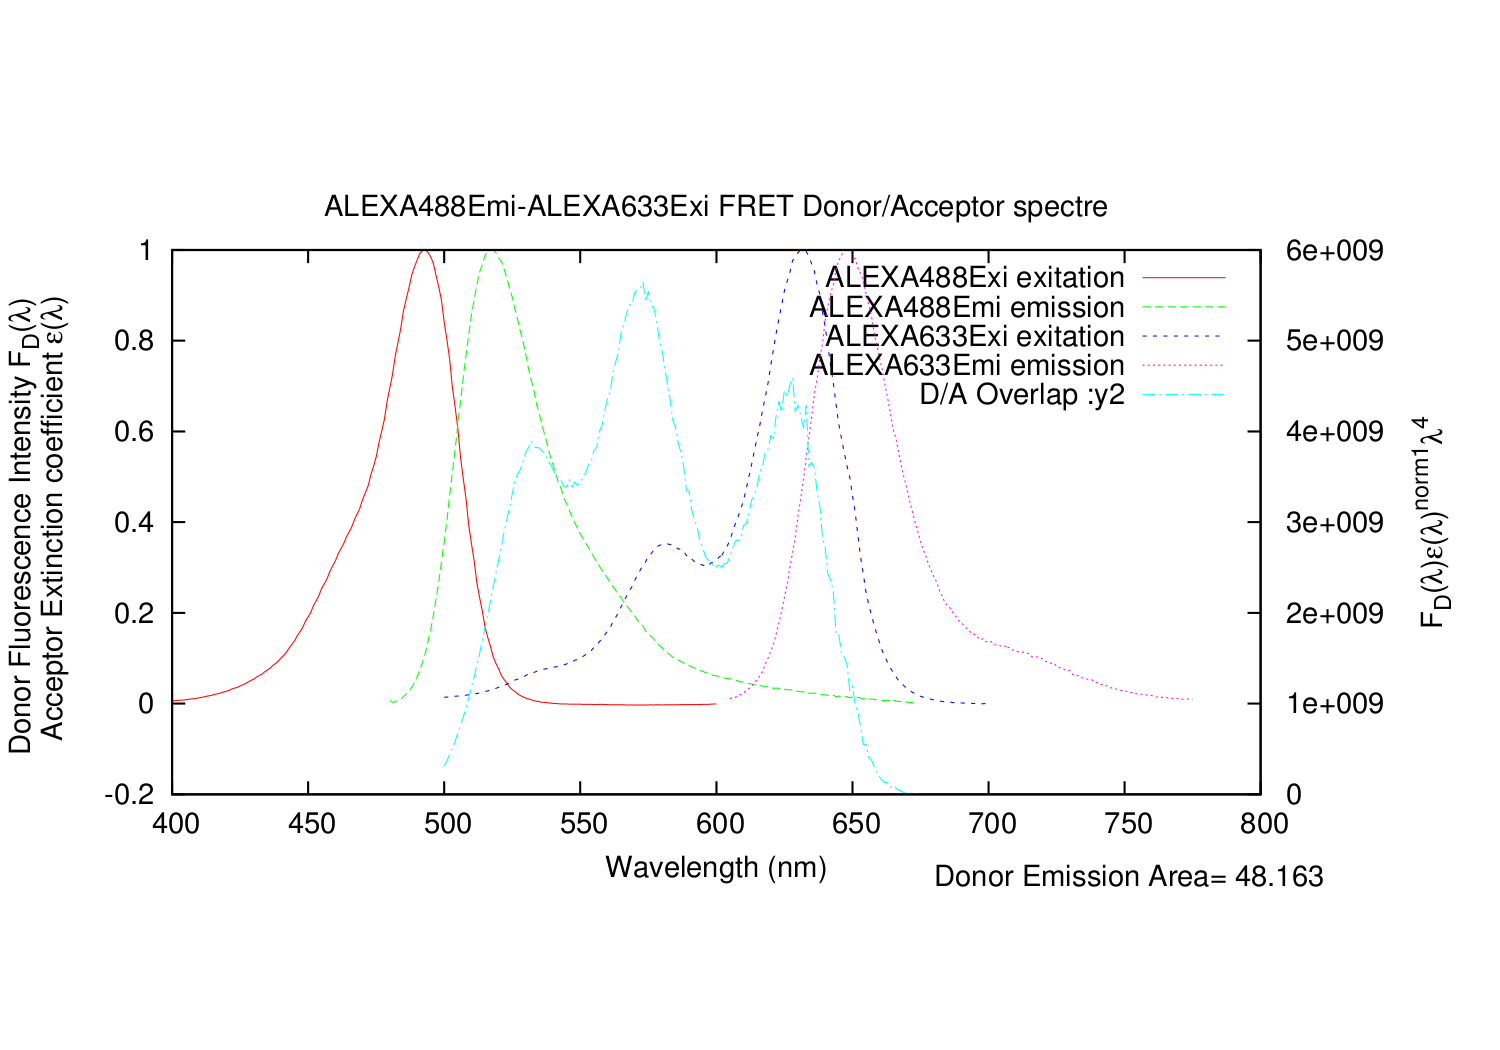
All graphs plotted together, but not scaled correctly.
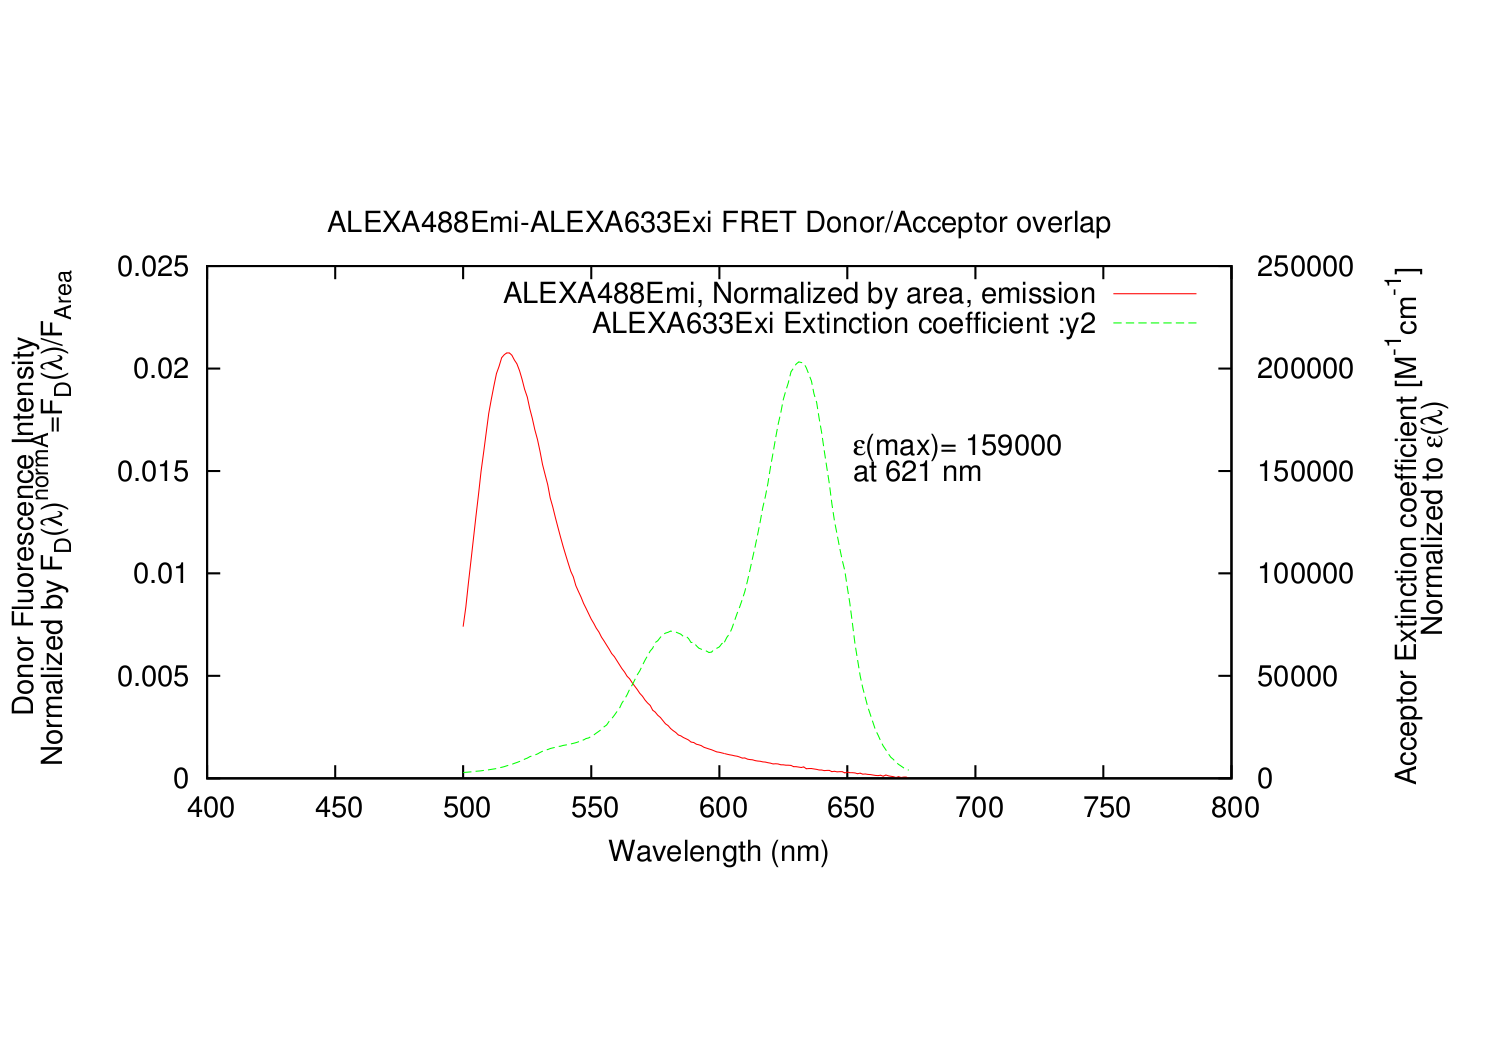
The Donor emission (y1) and Acceptor excitation (y2) scaled correctly.
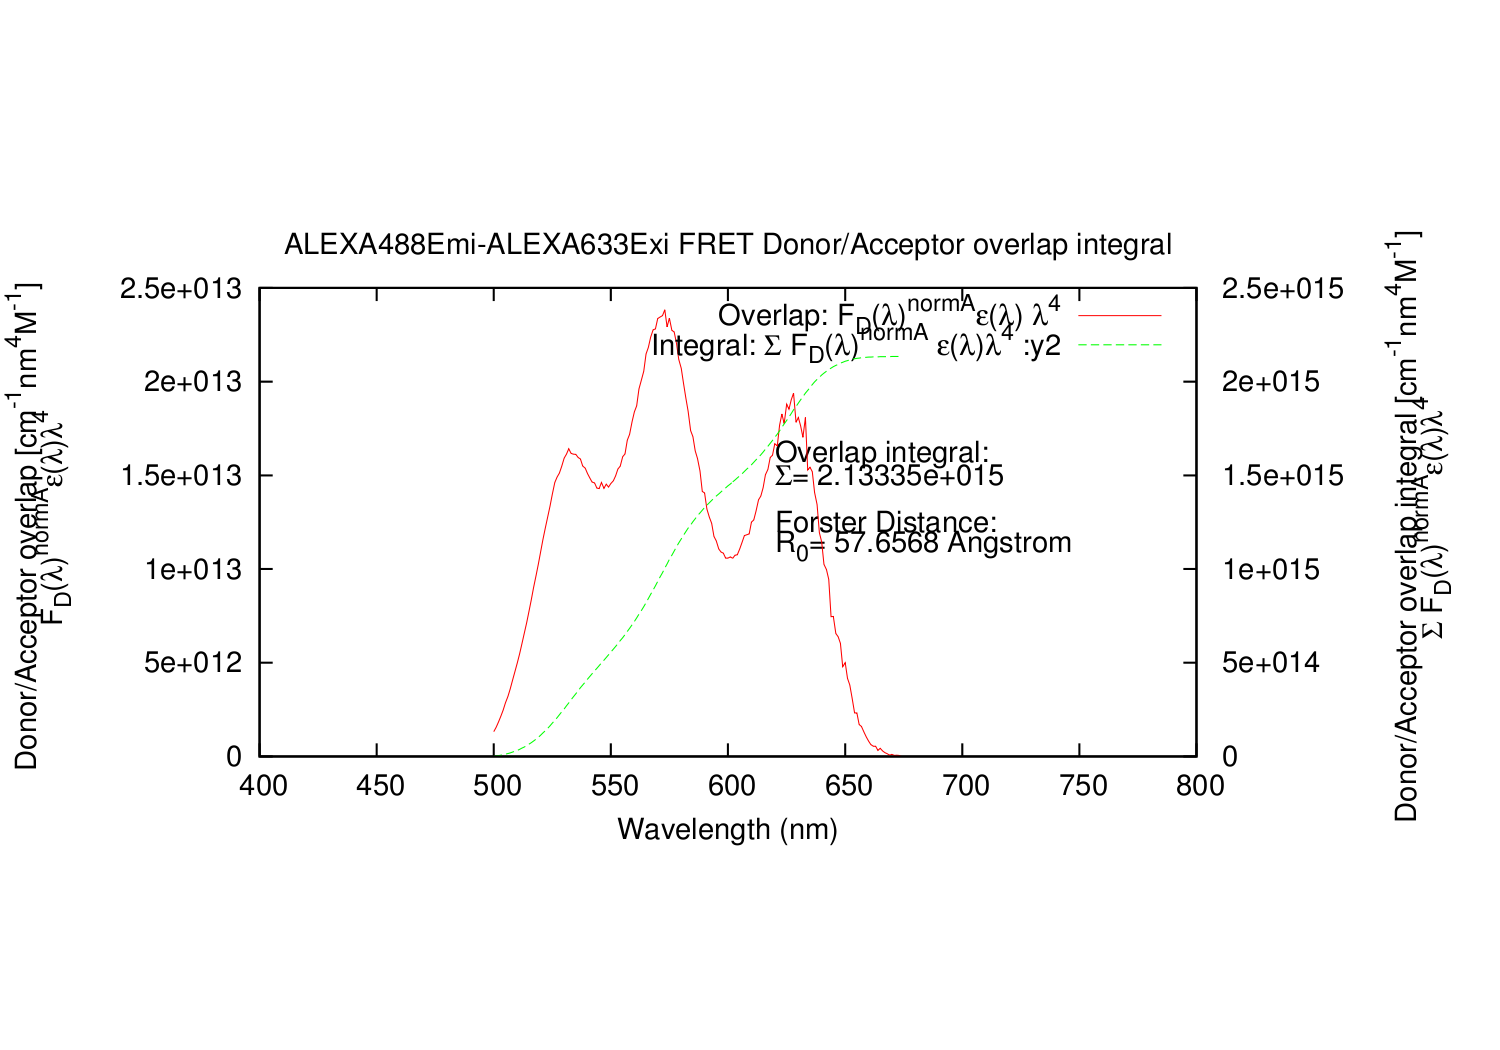
The Rectangle integral datapoint (y1) and the summed integration (y2).


How to run the script
Make a pymol .pml file like this. Write in the required information, and execute/run the script with pymol. Then open the .plt file afterwards with pymol.
## Change to your directory
cd /homes/YOU/Documents/Atto-dyes/Spectre/ALEXA488-ALEXA633
import forster
forster D_Exi=ALEXA488Exi.txt, D_Emi=ALEXA488Emi.txt, A_Exi=ALEXA633Exi.txt, A_Emi=ALEXA633Emi.txt, A_e_Max_Y=159000, A_e_Max_X=621, Qd=0.92
Python Code: forster.py
The code can be downloaded fast from here http://tinyurl.com/pymolforster
- wget http://tinyurl.com/pymolforster
- mv pymolforster forster.py
try: from pymol import cmd; runningpymol='yes'
except: runningpymol='no'; pass
import os, platform, math

#-------------------------------------------------------------------------------
# Name:		Forster
# Purpose:	Forster resonance energy transfer calculator.
#		Input is manufactor provided spectres of Donor emission and
#		acceptor excitation spectrum.
#
#		Carl Boswell and co. have made a new homepage with a long list of dyes which can be downloaded.
#		With a graphics program, they have traced several spectre of dyes from the literature and made this easily public at:
#		http://www.spectra.arizona.edu/    I highly recommend this homepage.
#		With these Spectra, the script can calculate the Forster Distance for different dyes from different companies.
#		Download "one spectrum at the time" by "deselecting" one of the spectre in the right side of the graph window.
#		Then get the datafile with the button in the lower right corner.
##
#		Made from
#		http://en.wikipedia.org/wiki/F%C3%B6rster_resonance_energy_transfer#Theoretical_basis
#		{R_0}^6 = \frac{9\,Q_0 \,(\ln 10) \kappa^2 \, J}{128 \, \pi^5 \,n^4 \, N_A}
#
# Author:	Troels Emtekaer Linnet: tlinnet@gmail.com
#
# Created:	29/03/2011
# Copyright:	(c) tlinnet 2011
# Licence:	Free for all
#-------------------------------------------------------------------------------
#Ref(1)
# Biochemistry 1997, 36, 11261-11272
# M. Pilar Lillo, Joseph M. Beechem, Barbara K. Szpikowska, Mark A. Sherman, and Maria T. Mas
#Design and Characterization of a Multisite Fluorescence Energy-Transfer System for Protein Folding Studies: A Steady-State and Time-Resolved Study of Yeast Phosphoglycerate Kinase
#
# NOTES:
# Datafiles: 	Two column file. Space separated. Numbers are "." dot noted. First column is in nanometers nm. Second column is arbitrary units of fluorescence/emission.
# 		If you have collected Donor Exitation and Acceptor Emission, they can be collected and plotted in gnuplot automatically. Set: Compare"yes"

# xunit="nm":	Enter x values in "nm" or "cm".
# A_e_Max_Y :	Acceptor maximum molar extinction coefficient. In units of M-1 cm-1. Approx 60000 - 1500000
# A_e_Max_X :	Enter at which wavelength (in nm) the maximum absorption occurs.
# Qd=0.8    :	Fluorescence quantum yield of the donor in the absence of the acceptor. Qd = neta_fl = n_fl / n_abs = n_emi / n_exi
# k2 = 2.0/3.0	Dipole orientation factor.
# n = 1.33  : 	Refractive index of the medium. water=1.33, protein=1.4, n2MGuHCl=1.375 Ref(1)
# NA = 6.02214179e+023 # (units: Number*mol-1 )Avogadros number

def forster(D_Exi="ATTO488Exi.txt",D_Emi="ATTO488Emi.txt",A_Exi="ATTO590Exi.txt",A_Emi="ATTO590Emi.txt",A_e_Max_Y=120000,A_e_Max_X=594,Qd=0.8,k2=0.66667,n=1.33,Compare="yes",xunit="nm"):
	A_e_Max_Y=float(A_e_Max_Y);A_e_Max_X=float(A_e_Max_X);Qd=float(Qd);k2=float(k2);n=float(n);NA=6.02214179e+023
	print k2, Qd
	printAll = "ye" # To print out all info
	fileDexi, extDexi = os.path.splitext(D_Exi)
	fileDemi, extDemi = os.path.splitext(D_Emi)
	fileAexi, extAexi = os.path.splitext(A_Exi)
	fileAemi, extAemi = os.path.splitext(A_Emi)
	overlapname = fileDemi+"-"+fileAexi+"-overlap.dat"
	overlapfile = open(overlapname, "w")
	overlapgnuplotname = fileDemi+"-"+fileAexi+"-overlap.plt"
	overlapgnuplotfile = open(overlapgnuplotname, "w")
	print "\nI have opened two files for you: \n%s and %s" % (overlapname,overlapgnuplotname)
	print "The .plt should be opened with gnuplot to make the graphs."
	print "The created graphs are .eps files."
	print "They can be converted to pdf with the program: epstopdf or eps2pdf"
	print 'Part of LaTeX: C:\Program Files (x86)\MiKTeX 2.9\miktex'+"\\"+"bin"
	print "Or download here: http://tinyurl.com/eps2pdf"

	DonorEmi = open(D_Emi, "r")
	AcceptorExi = open(A_Exi, "r")
	lineDemi = DonorEmi.readlines()
	lineAexi = AcceptorExi.readlines()
	Demi = []
	Aexi = []

	for i in lineDemi:
		if not i.strip(): #If line cannot get stripped(does not exist), then continue
			continue
		else: #If line can get stripped
			if testfloat(str.split(i)[0]):
				Demi.append([float(str.split(i)[0]), float(str.split(i)[1])])
	AreaDemi = numintegrator(Demi)
	print "Nummerical integration of Donor emission spectrum, used for normalization, gives: Area=",AreaDemi

	for i in lineAexi:
		if not i.strip():
			continue
		else:
			if testfloat(str.split(i)[0]):
				Aexi.append([float(str.split(i)[0]), float(str.split(i)[1])])
				if float(str.split(i)[0]) == float(A_e_Max_X):
					Epsiloncorrection = [float(A_e_Max_X), float(str.split(i)[0]), float(str.split(i)[1])]

	# Making the overlap
	OverlapDataPoints = []
	OverlapSum = 0.0
	# For comparing two floating numbers, one have to be carefully. Setting error allowing difference
	eallow = 0.00000001
	for i in range(len(Demi)):
		for j in range(len(Aexi)):
			if Demi[i][0]-eallow < Aexi[j][0] and Demi[i][0]+eallow > Aexi[j][0]:
				Overlap = (Demi[i][1]*Aexi[j][1]*float(A_e_Max_Y)*math.pow(Demi[i][0],4))/(AreaDemi*Epsiloncorrection[2])
				OverlapSum = OverlapSum + Overlap
				OverlapDataPoints.append([Demi[i][0], Demi[i][1], Aexi[j][0], Aexi[j][1], Overlap, OverlapSum])

	AreaOverlap = numintegrator(OverlapDataPoints,0,4)
	Prefactor = ForsterPrefactor6(Qd,k2,n,NA,printAll)
	ForsterAng = ForsterCalc(Prefactor,AreaOverlap,xunit,printAll)

	# Outputting data
	overlapfile.write("Emi-wavelength Emi-value-norm1 Emi-value-normA Exi-wavelength Exi-value-norm1 Exti-coefficient      Overlap   Overlap-Sum\n");
	for line in range(len(OverlapDataPoints)):
		textline = "%4.1f %24.4f %15.4e %14.1f %15.4e %16.4e %12.4e %13.4e"%(OverlapDataPoints[line][0],OverlapDataPoints[line][1],float(OverlapDataPoints[line][1]/AreaDemi),OverlapDataPoints[line][2],OverlapDataPoints[line][3],float(A_e_Max_Y*OverlapDataPoints[line][3]/Epsiloncorrection[2]),float(OverlapDataPoints[line][4]),float(OverlapDataPoints[line][5]))
		overlapfile.write(textline+"\n")

	#Make gnuplot plot file
	overlapgnuplotfile.write("reset" + "\n")
	overlapgnuplotfile.write("cd "+"'"+os.getcwd()+"'"+"\n")
	overlapgnuplotfile.write("\n")
	overlapgnuplotfile.write("set xrange [400:800]"+"\n")
	overlapgnuplotfile.write("set ytics nomirror"+"\n")
	overlapgnuplotfile.write("set y2tics"+"\n")
	if xunit == "cm": overlapgnuplotfile.write("set xlabel 'Wavelength (cm)'"+"\n")
	else: overlapgnuplotfile.write("set xlabel 'Wavelength (nm)'"+"\n")
	overlapgnuplotfile.write("set size ratio 0.5"+"\n")
	overlapgnuplotfile.write("\n")
	overlapgnuplotfile.write("A_e_Max_Y = "+str(A_e_Max_Y)+"\n")
	overlapgnuplotfile.write("A_e_Max_X = "+str(A_e_Max_X)+"\n")
	overlapgnuplotfile.write("AreaDemi = "+str(AreaDemi)+"\n")
	overlapgnuplotfile.write("AreaOverlap = "+str(AreaOverlap)+"\n")
	overlapgnuplotfile.write("ForsterAng= "+str(ForsterAng)+"\n")
	overlapgnuplotfile.write("\n")
	if Compare == "yes":
		overlapgnuplotfile.write("#########################Graph 1#############################"+"\n")
		overlapgnuplotfile.write('set title '+'"'+fileDemi+"-"+fileAexi+' FRET Donor/Acceptor spectre"'+"\n")
		overlapgnuplotfile.write('set ylabel "Donor Fluorescence Intensity F_{D}({/Symbol l}) \\n Acceptor Extinction coefficient {/Symbol e}({/Symbol l})"'+"\n")
		overlapgnuplotfile.write('set y2label "F_{D}({/Symbol l}){/Symbol e}({/Symbol l})^{norm1}{/Symbol l}^{4}"'+"\n")
		overlapgnuplotfile.write("\n")
		overlapgnuplotfile.write('set label 1 "Donor Emission Area= %g", AreaDemi at graph 0.7, -0.15'+"\n")
		overlapgnuplotfile.write("\n")
		overlapgnuplotfile.write('set term postscript eps enhanced color'+"\n")
		overlapgnuplotfile.write('set output '+'"1-'+fileDemi+"-"+fileAexi+'-overlap-all-spectre.eps"'+"\n")
		overlapgnuplotfile.write('plot '+'"'+fileDexi+extDexi+'" using 1:2 title '+'"'+fileDexi+' exitation" with lines,\\'+"\n")
#		overlapgnuplotfile.write('"'+overlapname+'" using 1:2 title '+'"'+fileDemi+' emission" with lines,\\'+"\n")
#		overlapgnuplotfile.write('"'+overlapname+'" using 4:5 title '+'"'+fileAexi+' exitation" with lines,\\'+"\n")
		overlapgnuplotfile.write('"'+fileDemi+extDemi+'" using 1:2 title '+'"'+fileDemi+' emission" with lines,\\'+"\n")
		overlapgnuplotfile.write('"'+fileAexi+extAexi+'" using 1:2 title '+'"'+fileAexi+' exitation" with lines,\\'+"\n")
		overlapgnuplotfile.write('"'+fileAemi+extAemi+'" using 1:2 title '+'"'+fileAemi+' emission" with lines,\\'+"\n")
		overlapgnuplotfile.write('"'+overlapname+'" using 1:($2*$5*$1**4) title "D/A Overlap :y2" with lines axis x1y2'+"\n")
		overlapgnuplotfile.write("\n")
		overlapgnuplotfile.write("## Show in window, x11 for Linux"+"\n")
		overlapgnuplotfile.write("#set term x11"+"\n")
		overlapgnuplotfile.write("#set term windows"+"\n")
		overlapgnuplotfile.write("#replot"+"\n")
		overlapgnuplotfile.write("#pause -1"+"\n")
		overlapgnuplotfile.write("unset label"+"\n")
		overlapgnuplotfile.write("\n")
	overlapgnuplotfile.write("#########################Graph 2#############################"+"\n")
	overlapgnuplotfile.write('set title '+'"'+fileDemi+"-"+fileAexi+' FRET Donor/Acceptor overlap"'+"\n")
	overlapgnuplotfile.write('set ylabel "Donor Fluorescence Intensity \\n Normalized by F_{D}({/Symbol l})^{normA}=F_{D}({/Symbol l})/F_{Area}"'+"\n")
	overlapgnuplotfile.write('set y2label "Acceptor Extinction coefficient [M^{-1}cm^{-1}] \\n Normalized to {/Symbol e}({/Symbol l})"'+"\n")
	overlapgnuplotfile.write("\n")
	overlapgnuplotfile.write('set label 1 "{/Symbol e}(max)= %g", A_e_Max_Y at graph 0.63, 0.65'+"\n")
	overlapgnuplotfile.write('set label 2 "at %g '+xunit+'", A_e_Max_X at graph 0.63, 0.60'+"\n")
	overlapgnuplotfile.write("\n")
	overlapgnuplotfile.write('set term postscript eps enhanced color'+"\n")
	overlapgnuplotfile.write('set output '+'"2-'+fileDemi+"-"+fileAexi+'-overlap-normalized-spectre.eps"'+"\n")
	overlapgnuplotfile.write('plot '+'"'+overlapname+'" using 1:3 title '+'"'+fileDemi+', Normalized by area, emission" with lines,\\'+"\n")
	overlapgnuplotfile.write('"'+overlapname+'" using 4:6 title '+'"'+fileAexi+' Extinction coefficient :y2" with lines axis x1y2'+"\n")
	overlapgnuplotfile.write("\n")
	overlapgnuplotfile.write("## Show in window, x11 for Linux"+"\n")
	overlapgnuplotfile.write("#set term x11"+"\n")
	overlapgnuplotfile.write("#set term windows"+"\n")
	overlapgnuplotfile.write("#replot"+"\n")
	overlapgnuplotfile.write("#pause -1"+"\n")
	overlapgnuplotfile.write("unset label"+"\n")
	overlapgnuplotfile.write("\n")
	overlapgnuplotfile.write("#########################Graph 3#############################"+"\n")
	overlapgnuplotfile.write('set title '+'"'+fileDemi+"-"+fileAexi+' FRET Donor/Acceptor overlap integral"'+"\n")
	if xunit == "cm":
		overlapgnuplotfile.write('set ylabel "Donor/Acceptor overlap [cm^{3}M^{-1}] \\n F_{D}({/Symbol l})^{normA}{/Symbol e}({/Symbol l}){/Symbol l}^{4}"'+"\n")
		overlapgnuplotfile.write('set y2label "Donor/Acceptor overlap integral [cm^{3}M^{-1}] \\n {/Symbol S} F_{D}({/Symbol l})^{normA}{/Symbol e}({/Symbol l}){/Symbol l}^{4}"'+"\n")

	else:
		overlapgnuplotfile.write('set ylabel "Donor/Acceptor overlap [cm^{-1}nm^{4}M^{-1}] \\n F_{D}({/Symbol l})^{normA}{/Symbol e}({/Symbol l}){/Symbol l}^{4}"'+"\n")
		overlapgnuplotfile.write('set y2label "Donor/Acceptor overlap integral [cm^{-1}nm^{4}M^{-1}] \\n {/Symbol S} F_{D}({/Symbol l})^{normA}{/Symbol e}({/Symbol l}){/Symbol l}^{4}"'+"\n")
	overlapgnuplotfile.write("\n")
	overlapgnuplotfile.write('set label 1 "Overlap integral:" at graph 0.55, 0.65'+"\n")
	overlapgnuplotfile.write('set label 2 "{/Symbol S}= %g", AreaOverlap at graph 0.55, 0.60'+"\n")
	overlapgnuplotfile.write('set label 3 "Forster Distance:" at graph 0.55, 0.50'+"\n")
	overlapgnuplotfile.write('set label 5 "R_{0}= %g Angstrom", ForsterAng at graph 0.55, 0.45'+"\n")
	overlapgnuplotfile.write("\n")
	overlapgnuplotfile.write('set term postscript eps enhanced color'+"\n")
	overlapgnuplotfile.write('set output '+'"3-'+fileDemi+"-"+fileAexi+'-overlap-integral.eps"'+"\n")
	overlapgnuplotfile.write('plot '+'"'+overlapname+'" using 1:7 title "Overlap: F_{D}({/Symbol l})^{normA}{/Symbol e}({/Symbol l}) {/Symbol l}^{4}" with lines,\\'+"\n")
	overlapgnuplotfile.write('"'+overlapname+'" using 1:8 title "Integral: {/Symbol S} F_{D}({/Symbol l})^{normA} {/Symbol e}({/Symbol l}){/Symbol l}^{4} :y2" with lines axis x1y2'+"\n")
	overlapgnuplotfile.write("\n")
	overlapgnuplotfile.write("## Show in window, x11 for Linux"+"\n")
	overlapgnuplotfile.write("#set term x11"+"\n")
	overlapgnuplotfile.write("#set term windows"+"\n")
	overlapgnuplotfile.write("#replot"+"\n")
	overlapgnuplotfile.write("#pause -1"+"\n")
	overlapgnuplotfile.write("unset label")

	overlapgnuplotfile.close()
	overlapfile.close()
	return(ForsterAng)
if runningpymol !='no': cmd.extend("forster",forster)

def ForsterConstFactor6(NA,printAll):
	vForsterConstFactor6 = (9*math.log(10))/(128*math.pow(math.pi,5)*NA)
	if printAll == 'yes': print "Forster constant pre-factor is:", str(vForsterConstFactor6), "(units: mol)"
	return vForsterConstFactor6

def ForsterVariableFactor6(Qd,k2,n,printAll):
	vForsterVariableFactor6 = (k2*Qd)/(math.pow(n,4))
	if printAll == 'yes': print "Forster variable pre-factor is:", str(vForsterVariableFactor6), "(units: NIL)"
	return vForsterVariableFactor6

def ForsterPrefactor6(Qd,k2,n,NA,printAll):
	vForsterPrefactor6 = ForsterConstFactor6(NA,printAll)*ForsterVariableFactor6(Qd,k2,n,printAll)
	if printAll == 'yes': print "Forster pre-factor is:", str(vForsterPrefactor6), "(units: mol)"
	return vForsterPrefactor6

def ForsterCalcnm(fFPreFactor6, fAreaOverlap,printAll):
	if printAll == 'yes': print "Overlap sum is: ", str(fAreaOverlap), "(units: cm-1 nm^4 L mol-1)"
	Forster6 = fFPreFactor6*fAreaOverlap
	if printAll == 'yes': print "Forster distance 6th power:", str(Forster6), "(units: cm-1 nm^4 L), obs(1L=1e-3m^3)"
	Forster6m = Forster6*100*math.pow(1e-9,4)*1e-3 #1e-3 is conversion from 1L = 1e-3 m3
	if printAll == 'yes': print "Forster distance 6th power:", str(Forster6m), "(units: meter m^6)"
	Forster6Ang = Forster6m*math.pow(1e10, 6.0)
	if printAll == 'yes': print "Forster distance Angstrom 6th power:", "%e" % (Forster6Ang), "(units: Angstrom^6)"
	ForsterAng = math.pow(Forster6Ang, 1.0/6.0)
	print "Forster distance:", str(ForsterAng), "(units: Angstrom)"
	return ForsterAng

def ForsterCalccm(fFPreFactor6, fAreaOverlap,printAll):
	if printAll == 'yes': print "Overlap sum is: ", str(fAreaOverlap), "(units: cm^3 L mol-1)"
	Forster6 = fFPreFactor6*fAreaOverlap
	if printAll == 'yes': print "Forster distance 6th power:", str(Forster6), "(units: cm^3 L), obs(1L=1e-3m^3)"
	Forster6m = Forster6*math.pow(1e-2,3)*1e-3 #1e-3 is conversion from 1L = 1e-3 m3
	if printAll == 'yes': print "Forster distance 6th power:", str(Forster6m), "(units: meter m^6)"
	Forster6cm = Forster6m*math.pow(1e2, 6.0)
	if printAll == 'yes': print "Forster distance cm 6th power:", "%e" % (Forster6cm), "(units: cm^6)"
	Forster6Ang = Forster6m*math.pow(1e10, 6.0)
	if printAll == 'yes': print "Forster distance Angstrom 6th power:", "%e" % (Forster6Ang), "(units: Angstrom^6)"
	ForsterAng = math.pow(Forster6m, 1.0/6.0)
	print "Forster distance:", str(ForsterAng), "(units: Angstrom)"
	return ForsterAng

def ForsterCalc(fFPreFactor6, fAreaOverlap,xunit,printAll):
	if xunit == "nm":
		Value = ForsterCalcnm(fFPreFactor6, fAreaOverlap,printAll)
	if xunit == "cm":
		Value = ForsterCalccm(fFPreFactor6, fAreaOverlap,printAll)
	return Value

def testfloat(x):
	try:
		v=float(x)
		return x
	except:
		return False

def numintegrator(fluarray, col1=0, col2=1):
	xprev = 0; xpres = 0; yprev = 0; ypres = 0; summing = 0
	for i in range(len(fluarray)):
		# Have to skip first datapoint
		if i > 0:
			xprev = xpres; yprev = ypres
			xpres = fluarray[i][col1]; ypres = fluarray[i][col2]
			summing = yprev*(xpres-xprev)+(ypres-yprev)*(xpres-xprev)/2.0 + summing
		else:
			xpres = fluarray[i][col1]; ypres = fluarray[i][col2]
	return summing