File list
Jump to navigation
Jump to search
This special page shows all uploaded files.
| Date | Name | Thumbnail | Size | User | Description | Versions |
|---|---|---|---|---|---|---|
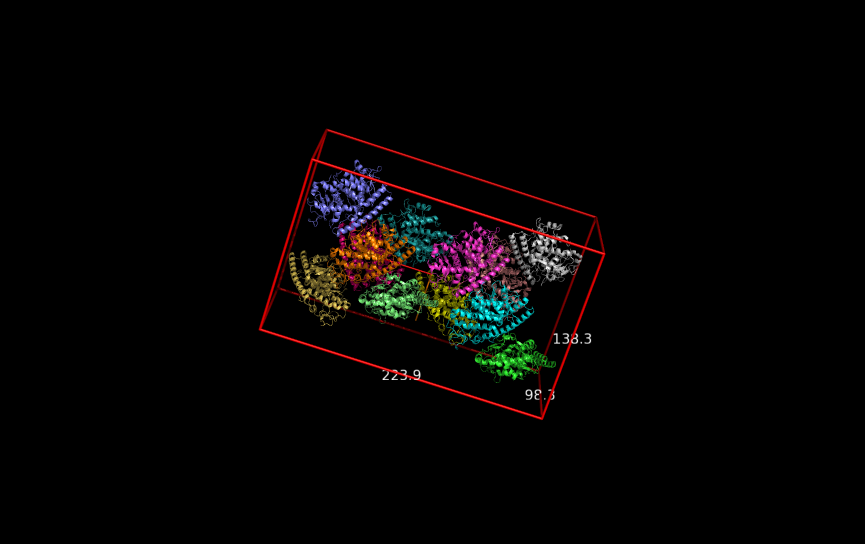
| 14:29, 25 May 2016 | Drawgridbox padding.png (file) |  |
176 KB | Clgeng | 2 | |
| 14:14, 25 May 2016 | Drawgridbox.png (file) |  |
161 KB | Clgeng | 2 | |
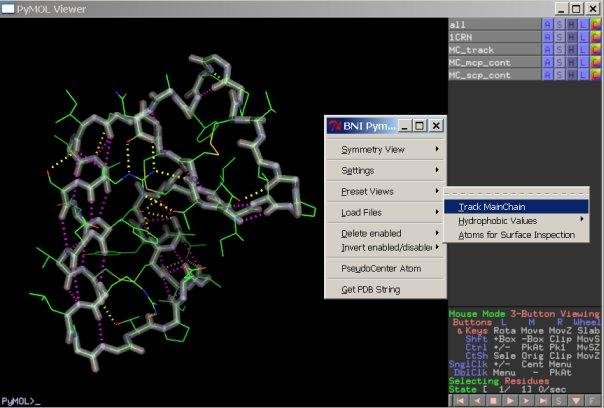
| 10:40, 12 May 2016 | Bni track.jpg (file) |  |
42 KB | Steinkeg | Created using bni-tools track main-chain preset. | 1 |
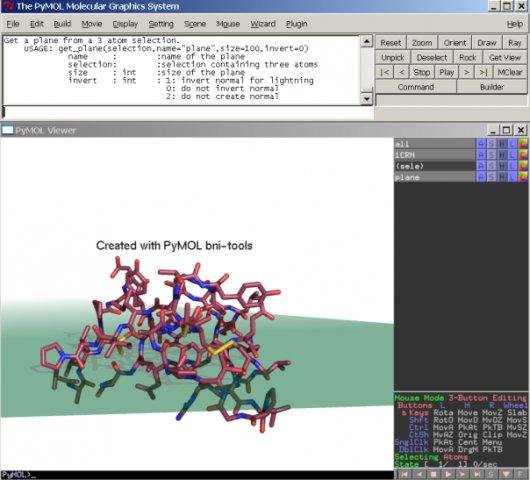
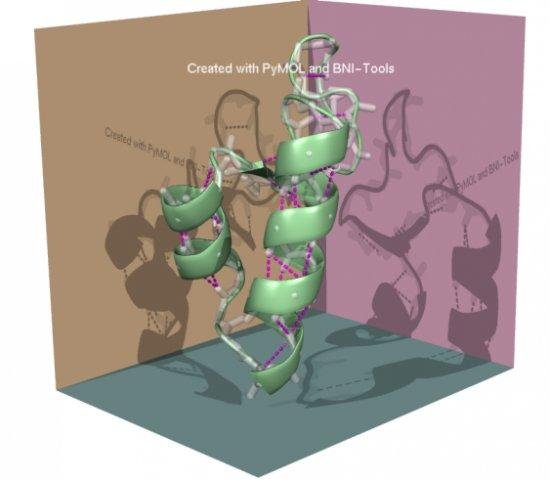
| 10:39, 12 May 2016 | Bni plane.jpg (file) |  |
43 KB | Steinkeg | Created using bni-tools plane command | 1 |
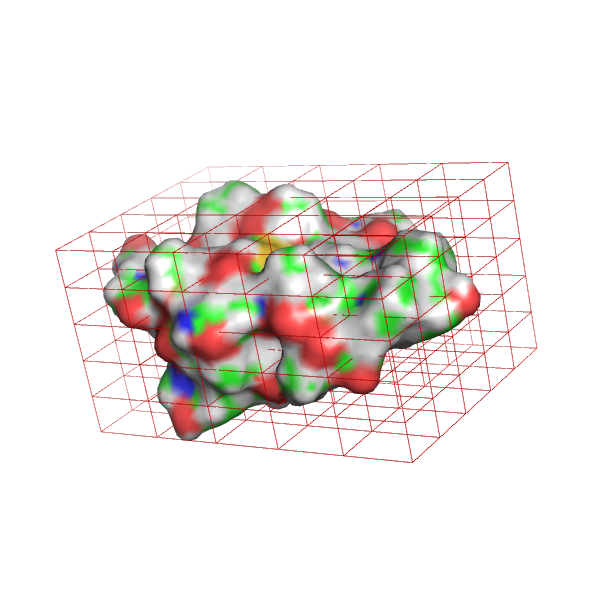
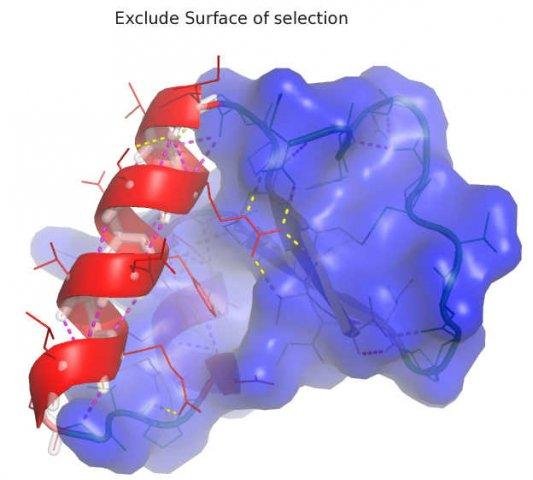
| 10:38, 12 May 2016 | Bni excludesurf.jpg (file) |  |
33 KB | Steinkeg | Image created by using bni-tools exclude surface command | 1 |
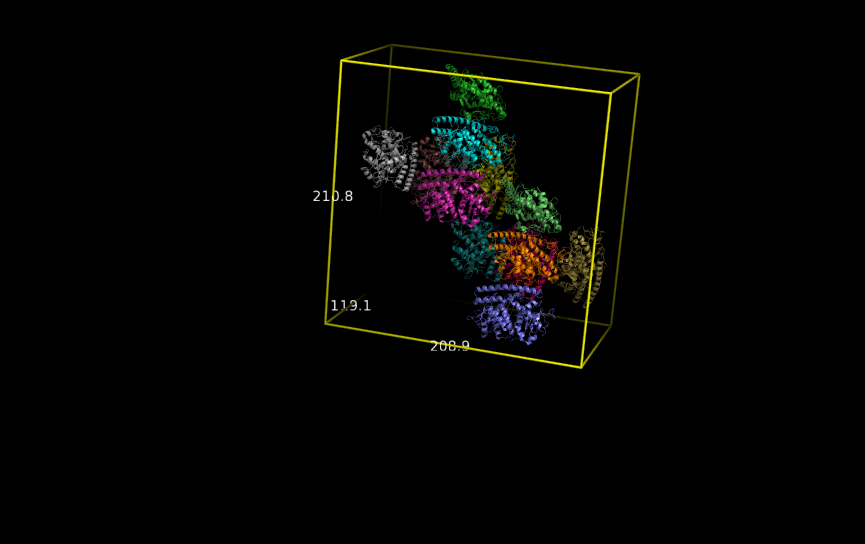
| 10:36, 12 May 2016 | Bni box2.jpg (file) |  |
38 KB | Steinkeg | Image created using bni-tools. | 1 |
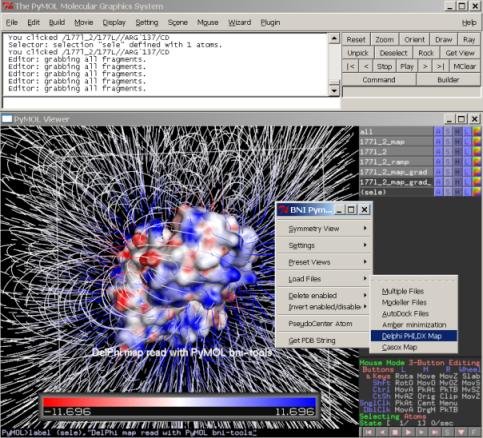
| 10:31, 12 May 2016 | Bni delphimap.jpg (file) |  |
70 KB | Steinkeg | Image created using bni-tools and delphi map load command. | 1 |
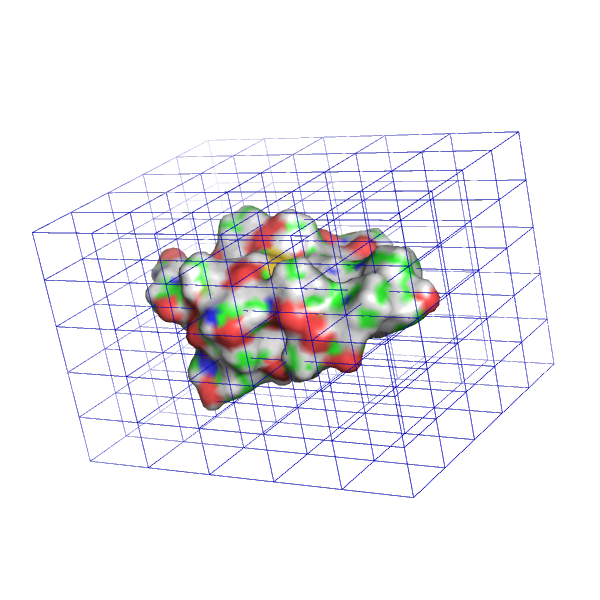
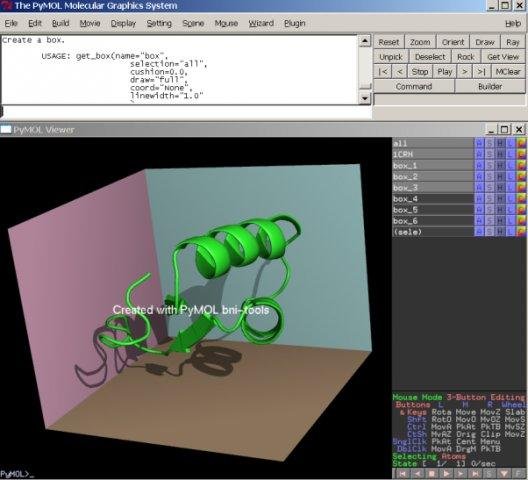
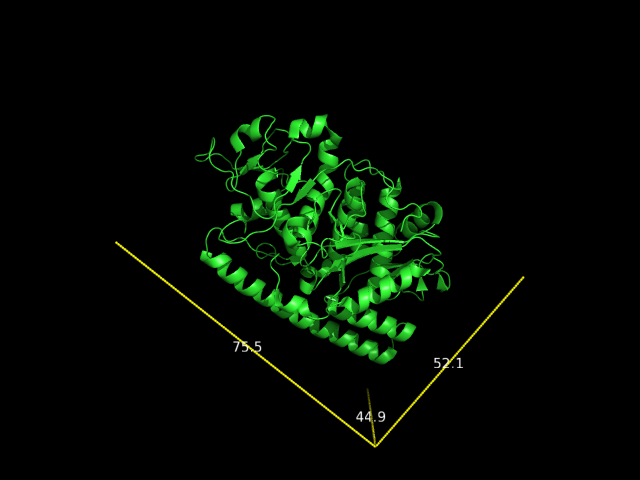
| 10:28, 12 May 2016 | Bni box.jpg (file) |  |
27 KB | Steinkeg | Image created using bni-tools box command. | 1 |
| 15:13, 5 May 2016 | Hdgyp cover.jpg (file) |  |
553 KB | Speleo3 | downsampled | 2 |
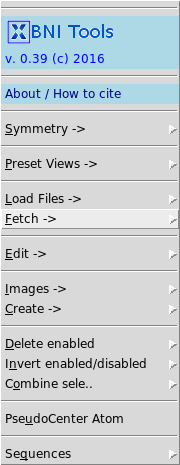
| 09:48, 28 April 2016 | Bnitools.png (file) |  |
14 KB | Speleo3 | Screenshot of the BNI Tools plugin menu | 1 |
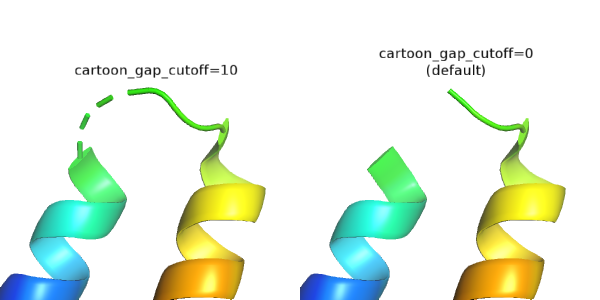
| 13:37, 12 April 2016 | Cartoon gap cutoff.png (file) |  |
42 KB | Speleo3 | 1 | |
| 13:24, 12 April 2016 | Test.jpg (file) |  |
16 KB | Inchoate | 1 | |
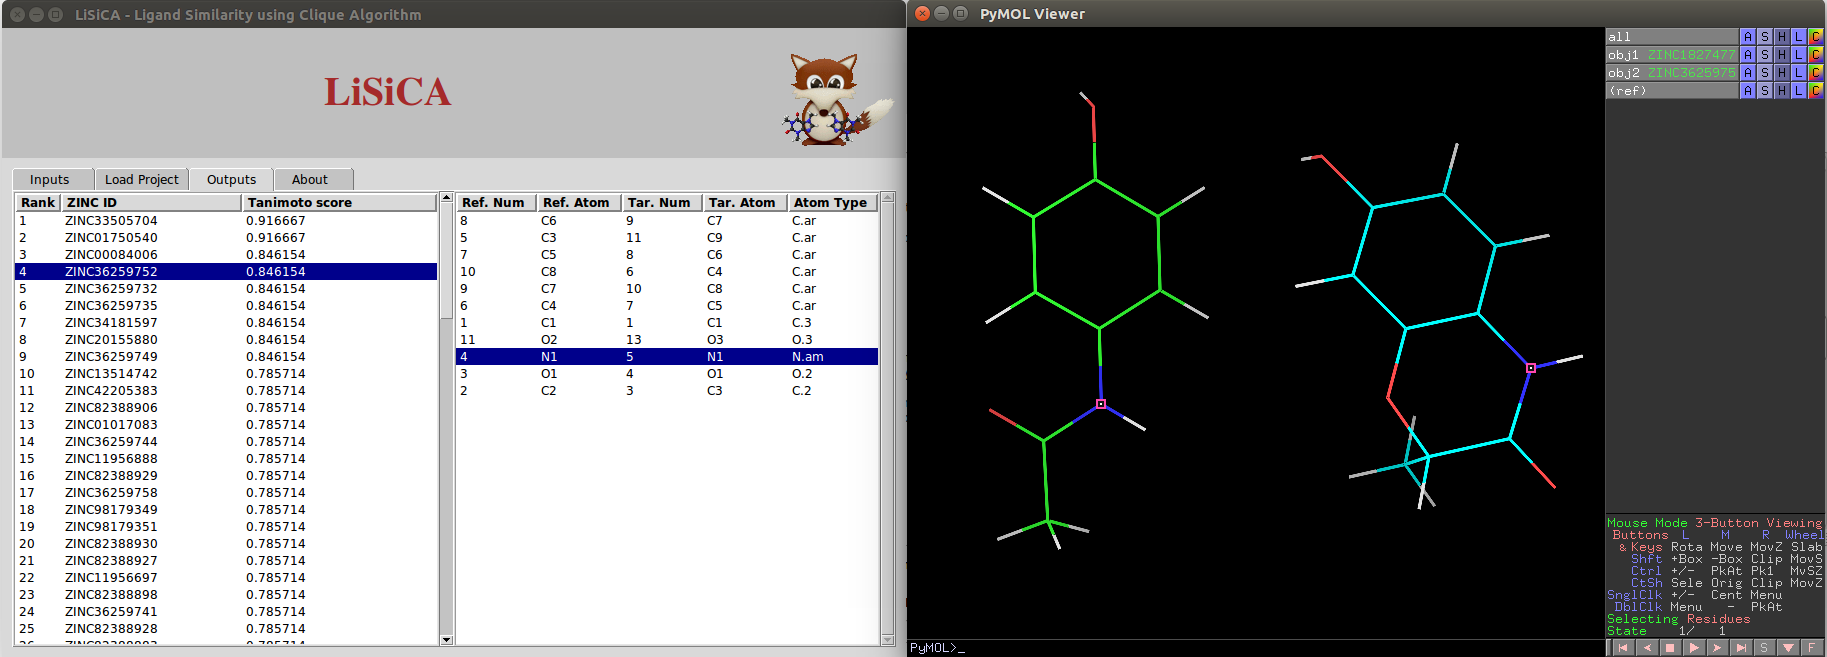
| 10:17, 18 November 2015 | 2DResultOutputtabPyMOLViewerLinux3.png (file) |  |
138 KB | JanezKonc | 1 | |
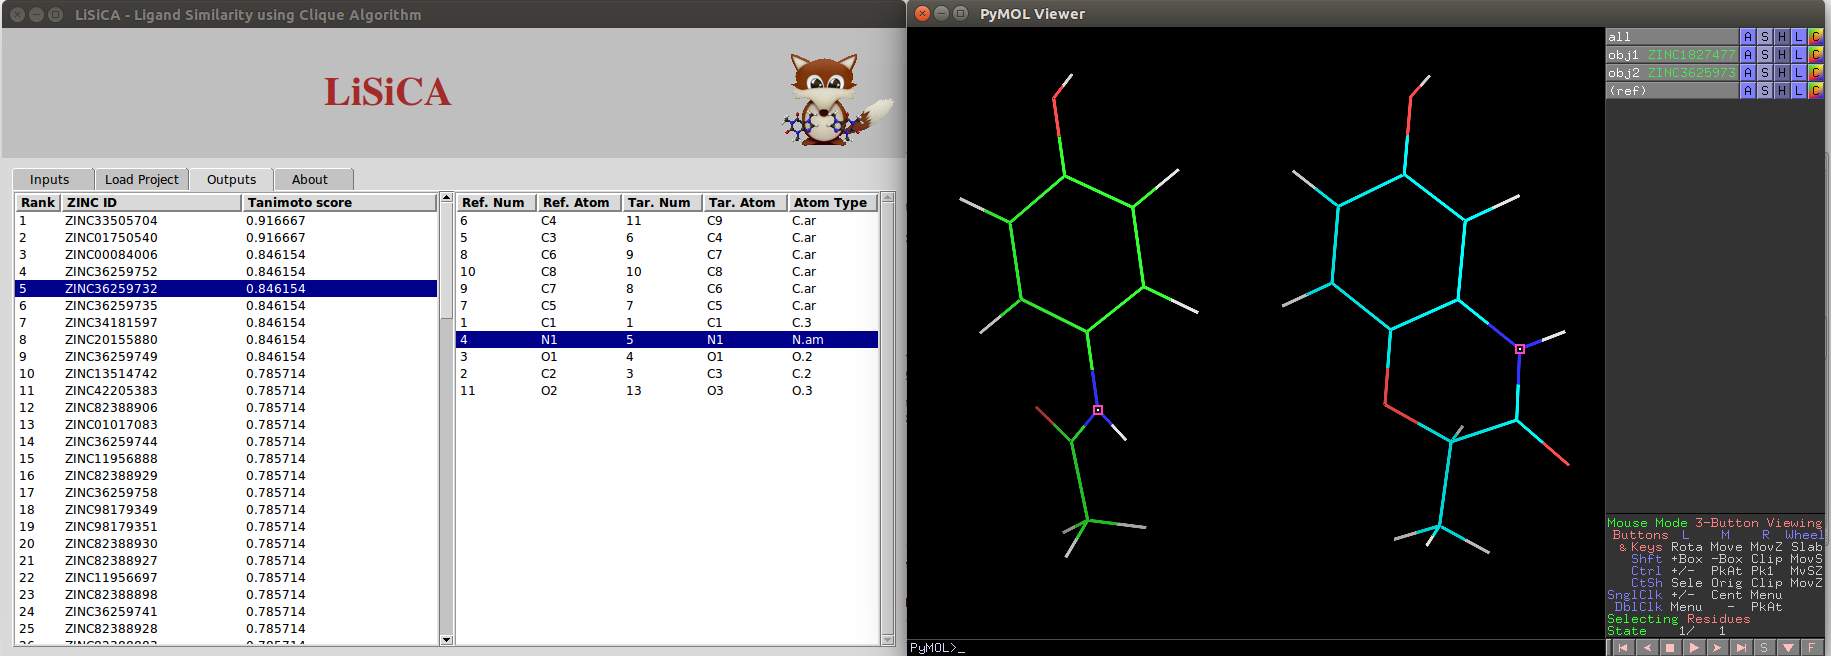
| 10:16, 18 November 2015 | 2DResultOutputtabPyMOLViewerLinux2.png (file) |  |
136 KB | JanezKonc | 1 | |
| 10:15, 18 November 2015 | 2DResultOutputtabPyMOLViewerLinux1.png (file) |  |
138 KB | JanezKonc | 1 | |
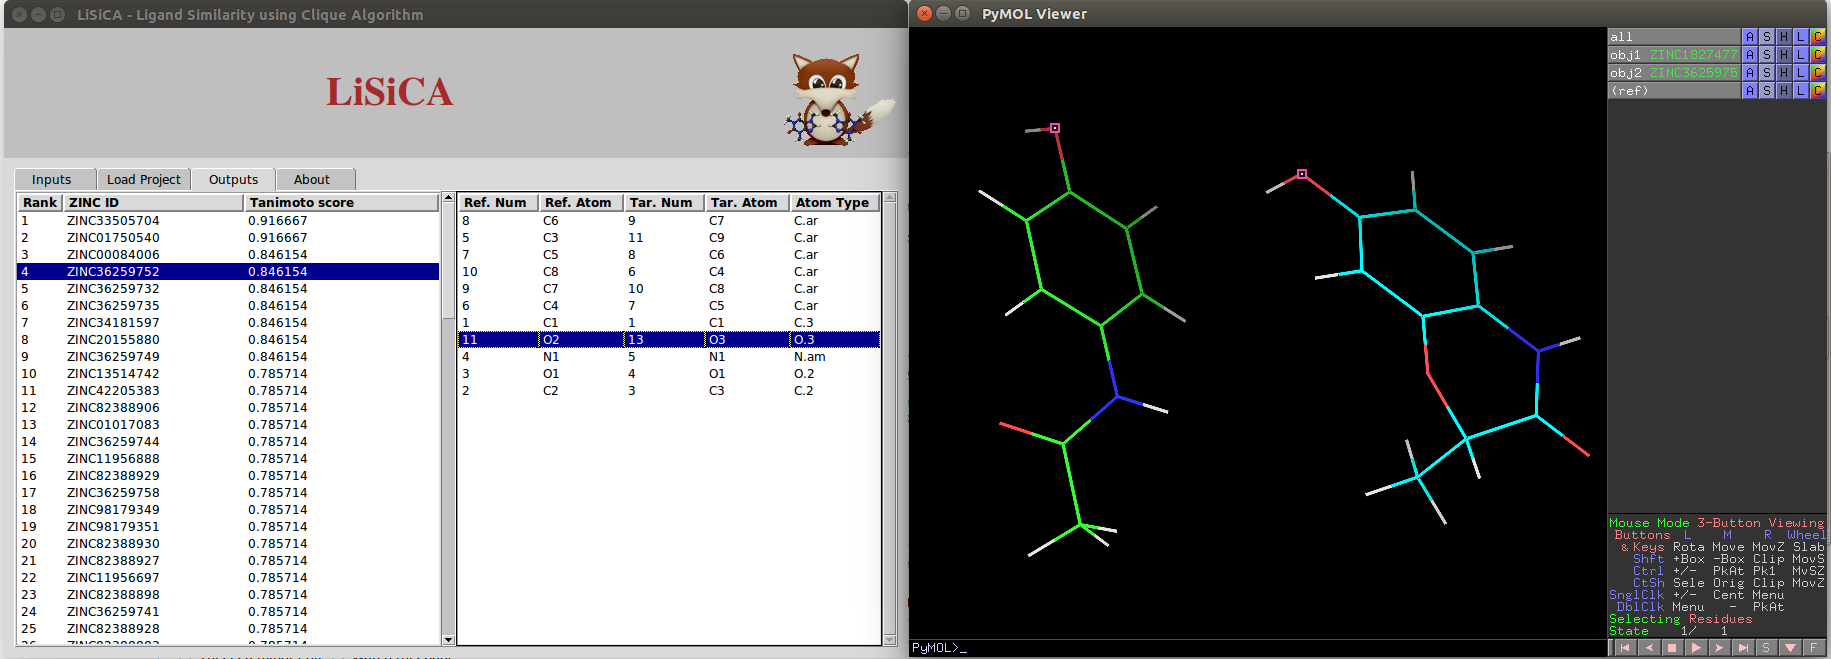
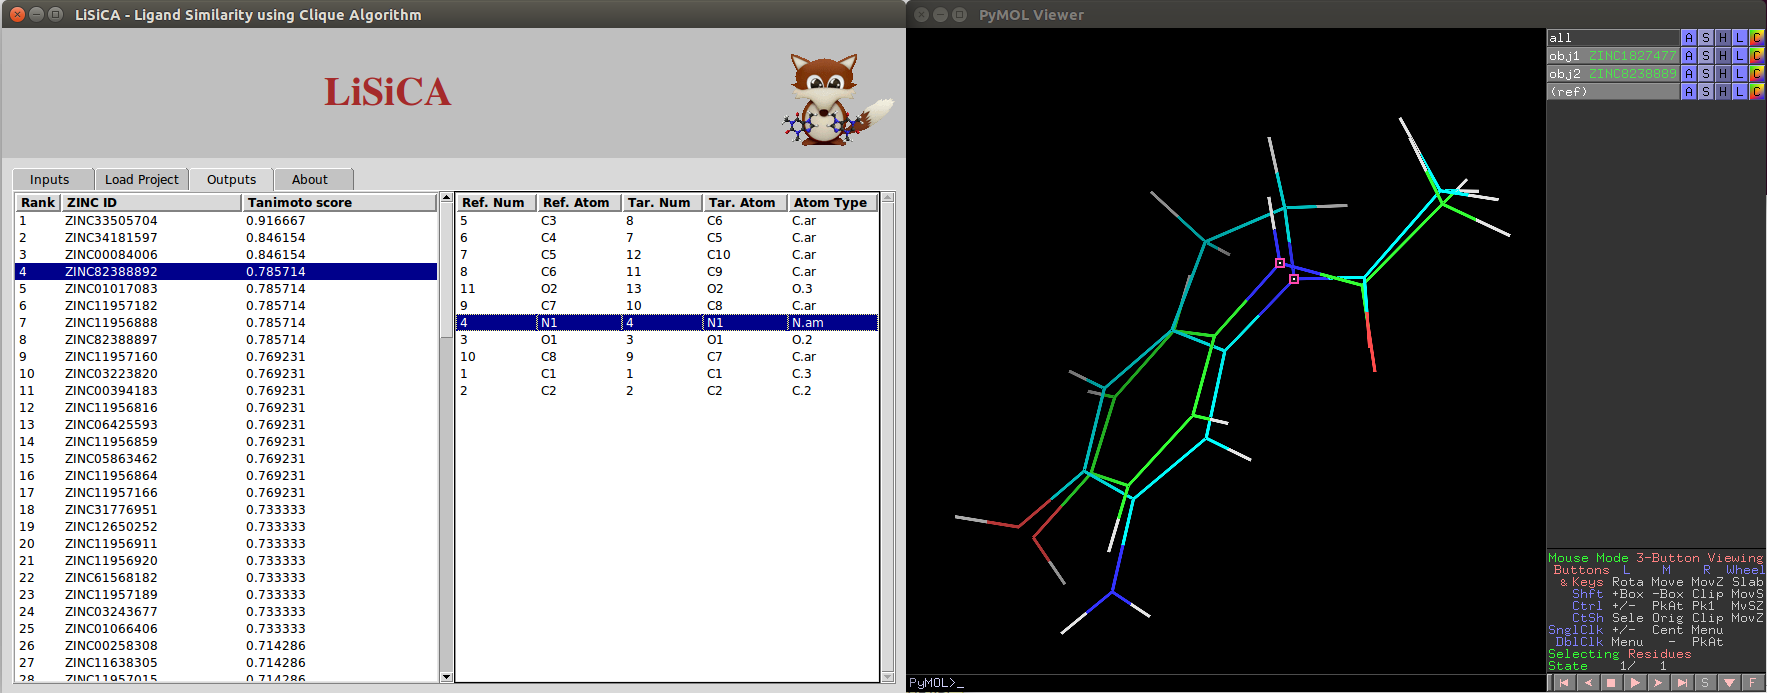
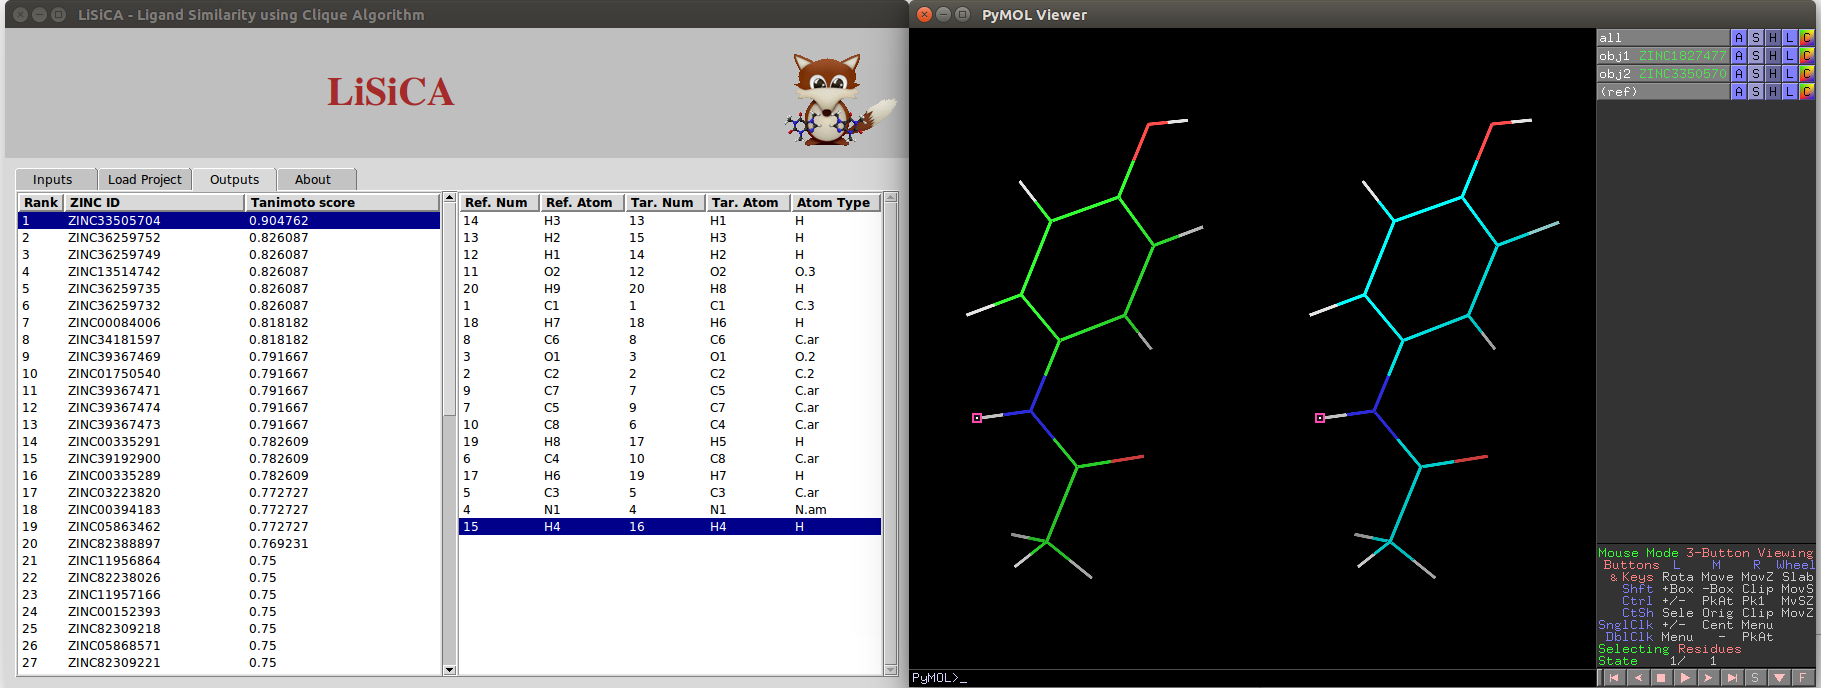
| 08:20, 18 November 2015 | 3DResultsOutputtabPyMOLViewer1.png (file) |  |
142 KB | JanezKonc | Sample results of 3D results displayed on the plugin. Screen shot of Output tab and the PyMOL viewer screen. | 2 |
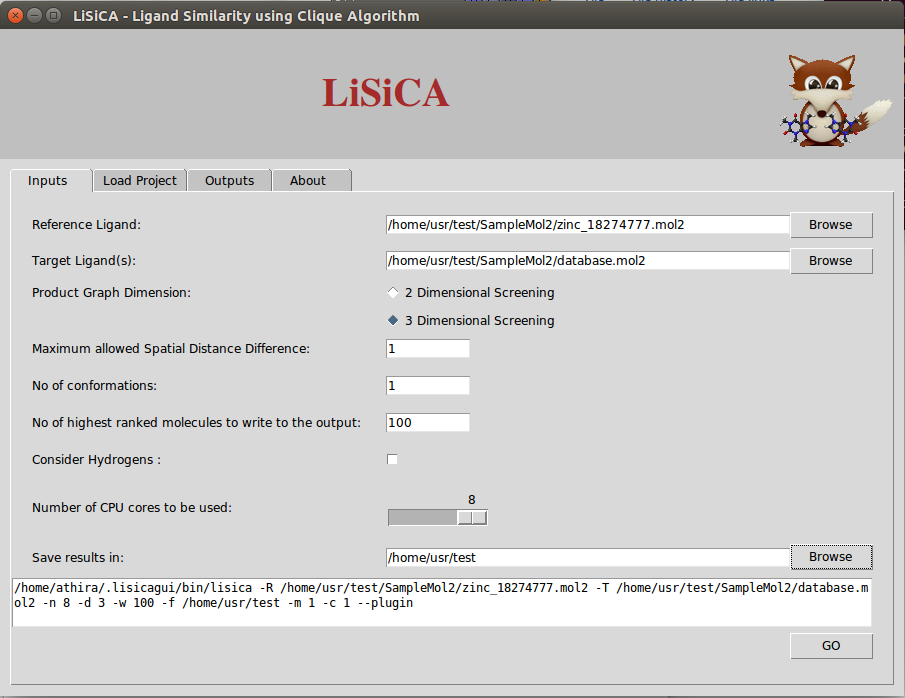
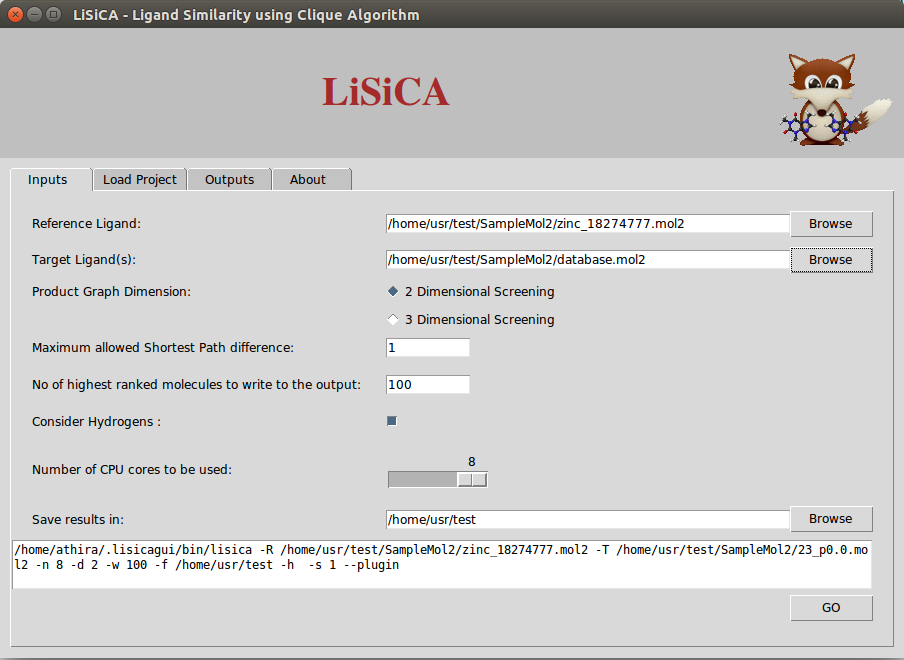
| 08:17, 18 November 2015 | InputTab3DLiSiCALinuxv1.0.0.png (file) |  |
70 KB | JanezKonc | Screen shot of the LiSiCA input tab with product graph dimension chosen as 3D. | 1 |
| 06:48, 18 November 2015 | LiSiCA2DResultsConsiderHydrogen.png (file) |  |
139 KB | JanezKonc | 1 | |
| 06:46, 18 November 2015 | ConsiderHydrogenInputtab2DLiSiCAv1.0.0.png (file) |  |
67 KB | JanezKonc | 2 | |
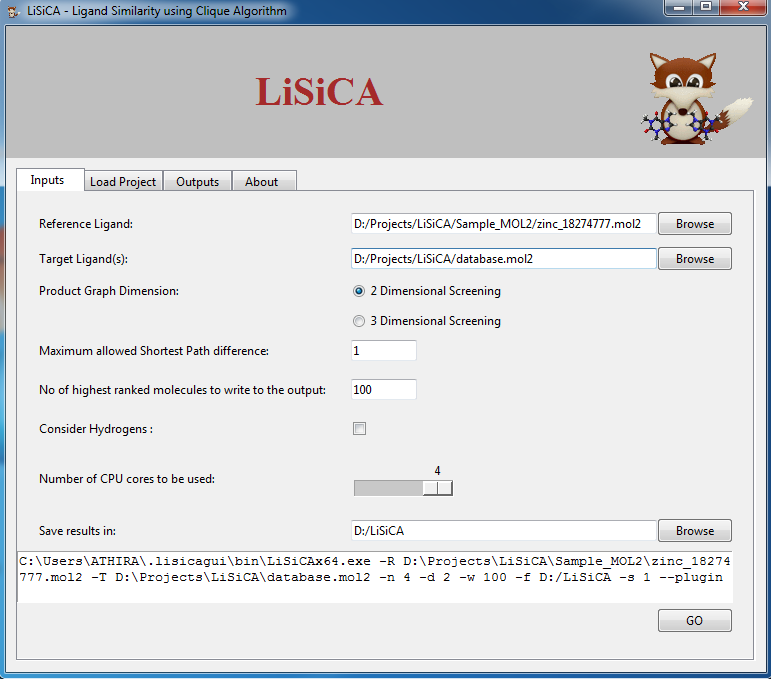
| 06:21, 18 November 2015 | InputTab2DLiSiCAWindows7v1.0.0.png (file) |  |
61 KB | JanezKonc | 2 | |
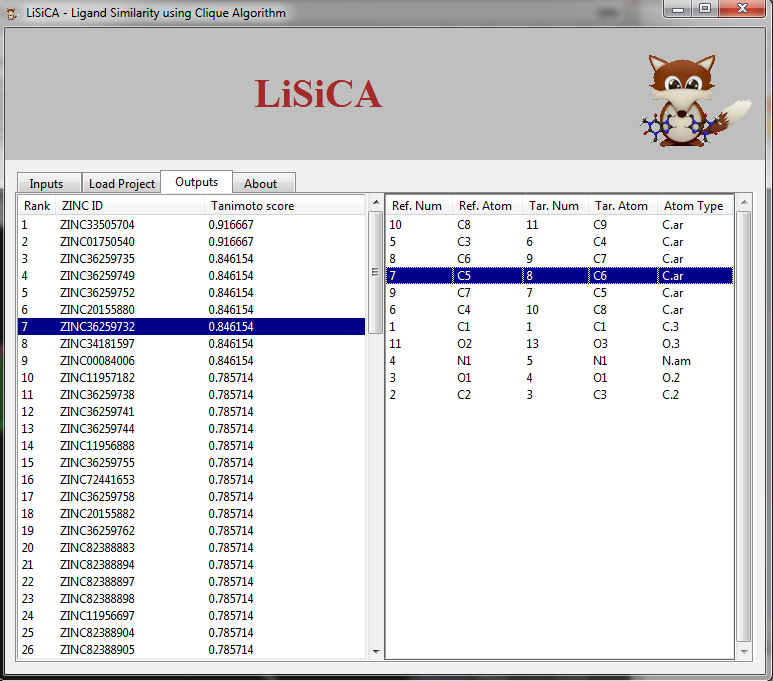
| 06:11, 18 November 2015 | OutputTab2DLiSiCAWindows7v1.0.0.png (file) |  |
70 KB | JanezKonc | Screen-shot of output tab on Windows 7 machine. | 1 |
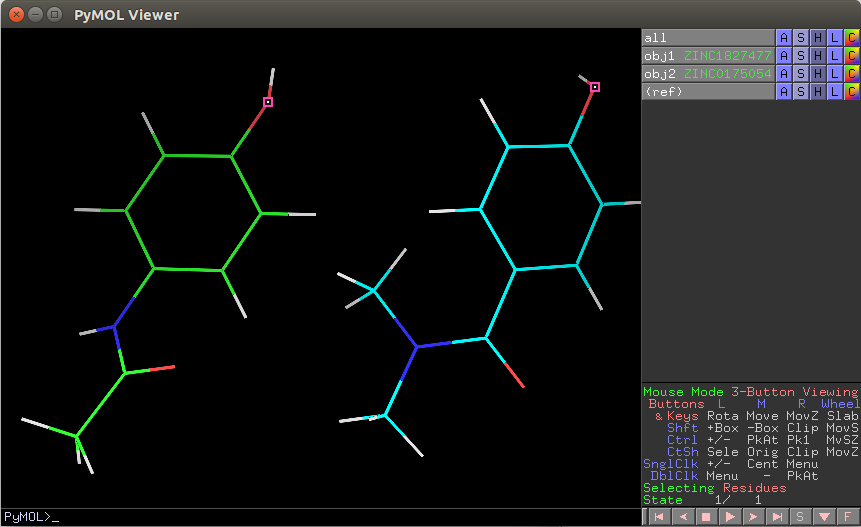
| 05:51, 18 November 2015 | PyMOLViewer2DLiSiCA.png (file) |  |
35 KB | JanezKonc | Screenshot of PyMOL Viewer screen displaying two molecules (the reference and one of the target molecules from the target database) side by side. 2D LiSiCA. The corresponding atoms of the substructure common to both the molecules is visualized/highlighte | 1 |
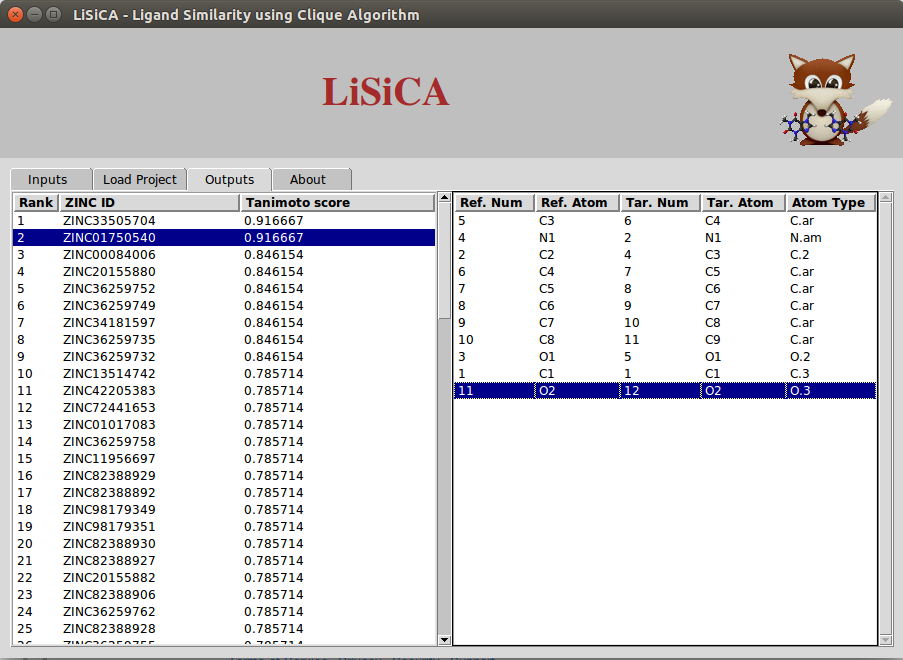
| 05:45, 18 November 2015 | OutputTab2DLiSiCALinuxv1.0.0.png (file) |  |
94 KB | JanezKonc | Screenshot of Output tab with results from a 2D LiSiCA. On Linux. LiSiCA version v1.0.0. | 1 |
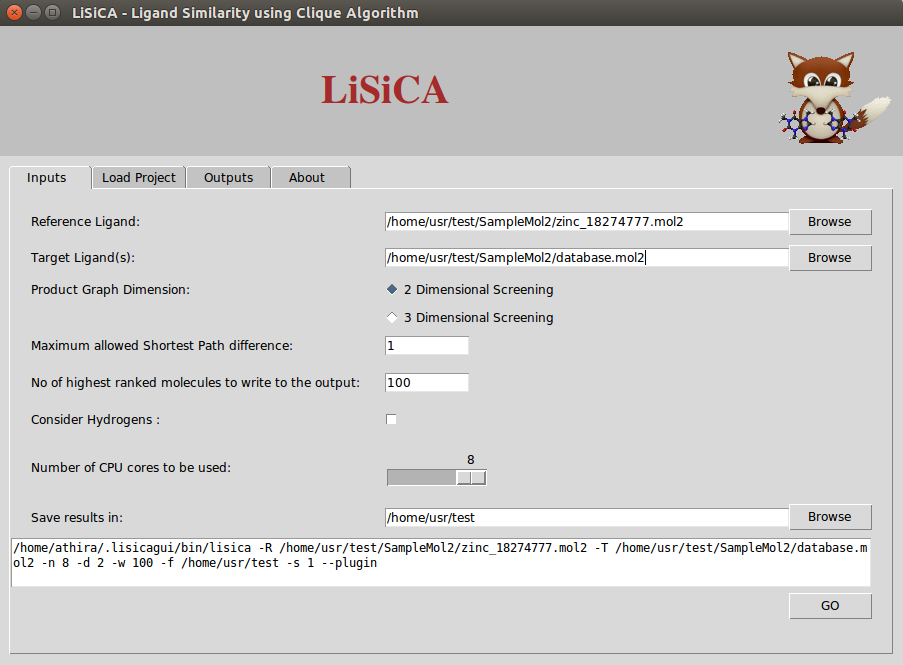
| 05:43, 18 November 2015 | InputTab2DLiSiCALinuxv1.0.0.png (file) |  |
66 KB | JanezKonc | Screenshot of Input tab with parameter selection for 2D LiSiCA v1.0.0. | 1 |
| 14:55, 31 October 2015 | Libgfortran.3.dylib.zip (file) | 264 KB | Bell | 2 | ||
| 14:06, 31 October 2015 | Helicity check-1.0.tar.zip (file) | 2 KB | Bell | 1 | ||
| 13:31, 31 October 2015 | Resicolor-0.1.tar.zip (file) | 913 bytes | Bell | 2 | ||
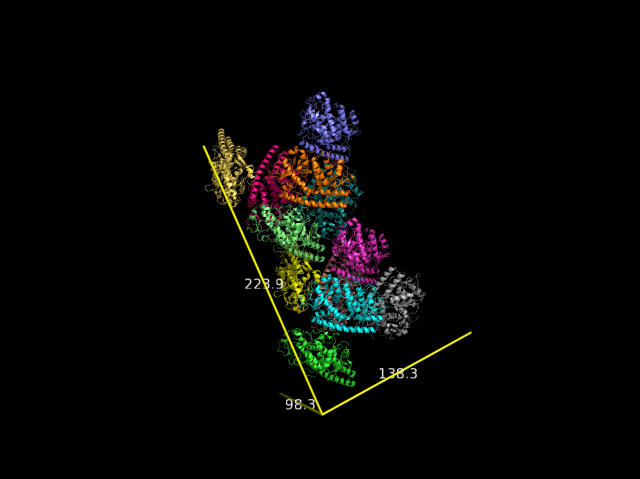
| 09:16, 14 October 2015 | 2vak ASU.png (file) |  |
92 KB | PabloGuardado | 1 | |
| 09:10, 14 October 2015 | 2vak A.png (file) |  |
78 KB | PabloGuardado | 1 | |
| 09:10, 14 October 2015 | 2vak AABB.png (file) |  |
98 KB | PabloGuardado | 1 | |
| 09:09, 14 October 2015 | 2vak IABB.png (file) |  |
111 KB | PabloGuardado | 1 | |
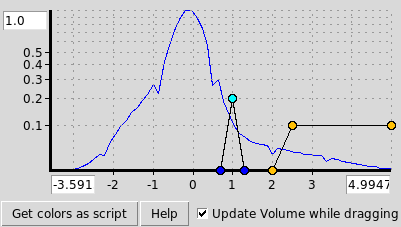
| 15:39, 10 September 2015 | 1okyVolPanel.png (file) |  |
5 KB | Speleo3 | Volume panel for File:1okyVol.png | 1 |
| 15:35, 10 September 2015 | 1okyVol.png (file) |  |
329 KB | Speleo3 | Volume visualization of electron density for PDB 1oky | 1 |
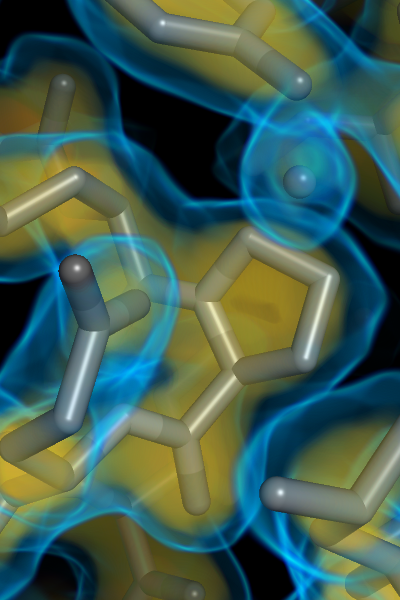
| 07:52, 9 September 2015 | Jctcce v011i009.jpg (file) |  |
1.73 MB | Mazen | About the Cover: The thermodynamic role of the conformational changes upon biomolecular interactions is shown to be exactly quantified using a distance measure from information theory, Kullback–Leibler (KL) divergence between the distributions of the co | 1 |
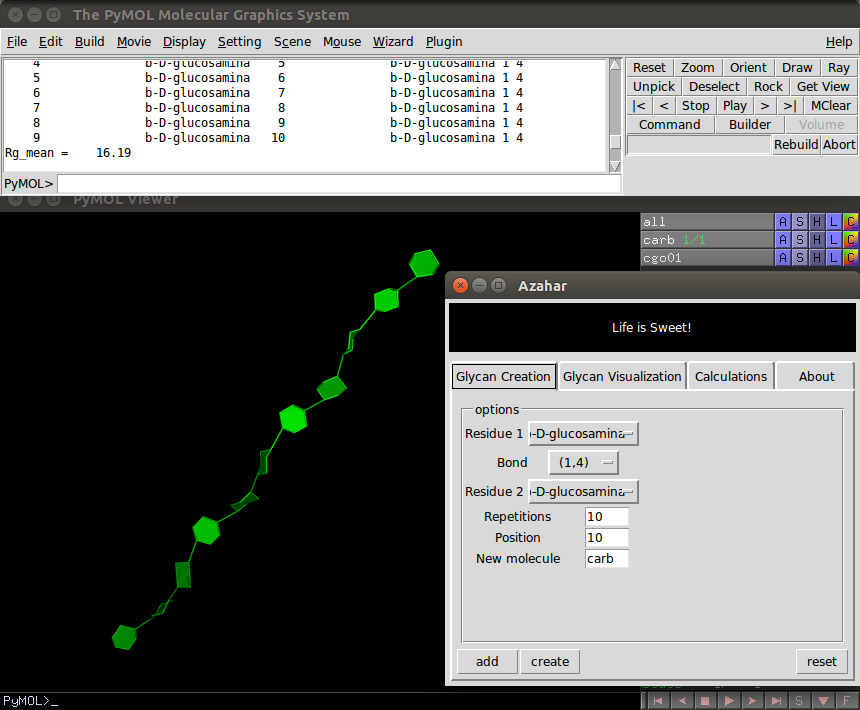
| 07:29, 9 September 2015 | Azahar GUI.png (file) |  |
102 KB | OsvaldoMartin | 1 | |
| 22:33, 8 September 2015 | J square.jpg (file) |  |
176 KB | Inchoate | Testing upload. | 1 |
| 14:12, 24 March 2015 | Frame slider.png (file) | 3 KB | Mpb21 | Screen shot of the Frame_slider GUI | 1 | |
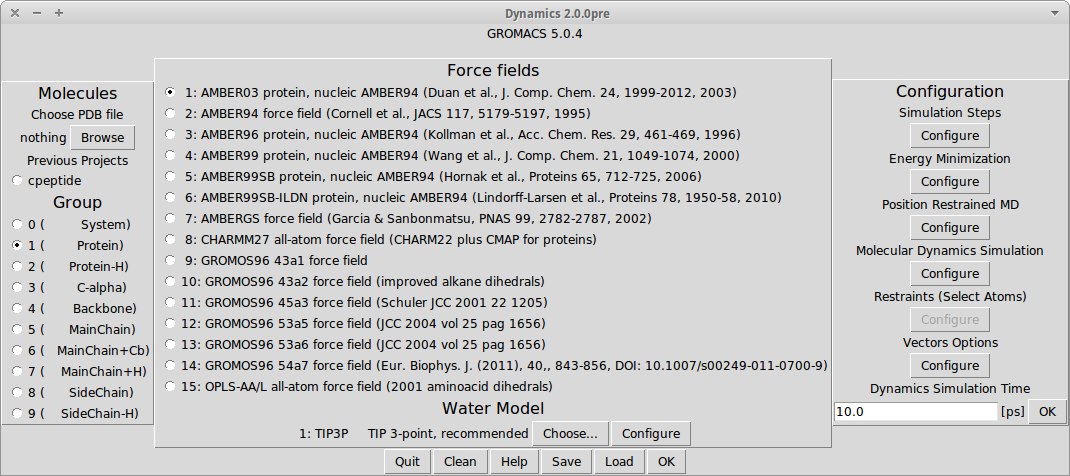
| 05:43, 10 March 2015 | Menu1.png (file) |  |
129 KB | TomaszMakarewicz | Dynamics PyMOL Plugin Menu 2.0 | 1 |
| 12:18, 15 December 2014 | 3rfg4.png (file) |  |
26 KB | PabloGuardado | 1 | |
| 12:17, 15 December 2014 | 3rfg3.png (file) |  |
25 KB | PabloGuardado | 1 | |
| 12:17, 15 December 2014 | 3rfg2.png (file) |  |
226 KB | PabloGuardado | 1 | |
| 12:17, 15 December 2014 | 3rfg1.png (file) |  |
258 KB | PabloGuardado | 1 | |
| 11:54, 15 December 2014 | 2vak4.png (file) |  |
91 KB | PabloGuardado | 1 | |
| 11:49, 15 December 2014 | 2vak2.png (file) |  |
30 KB | PabloGuardado | 1 | |
| 11:43, 15 December 2014 | 2vak 1.png (file) |  |
87 KB | PabloGuardado | 1 | |
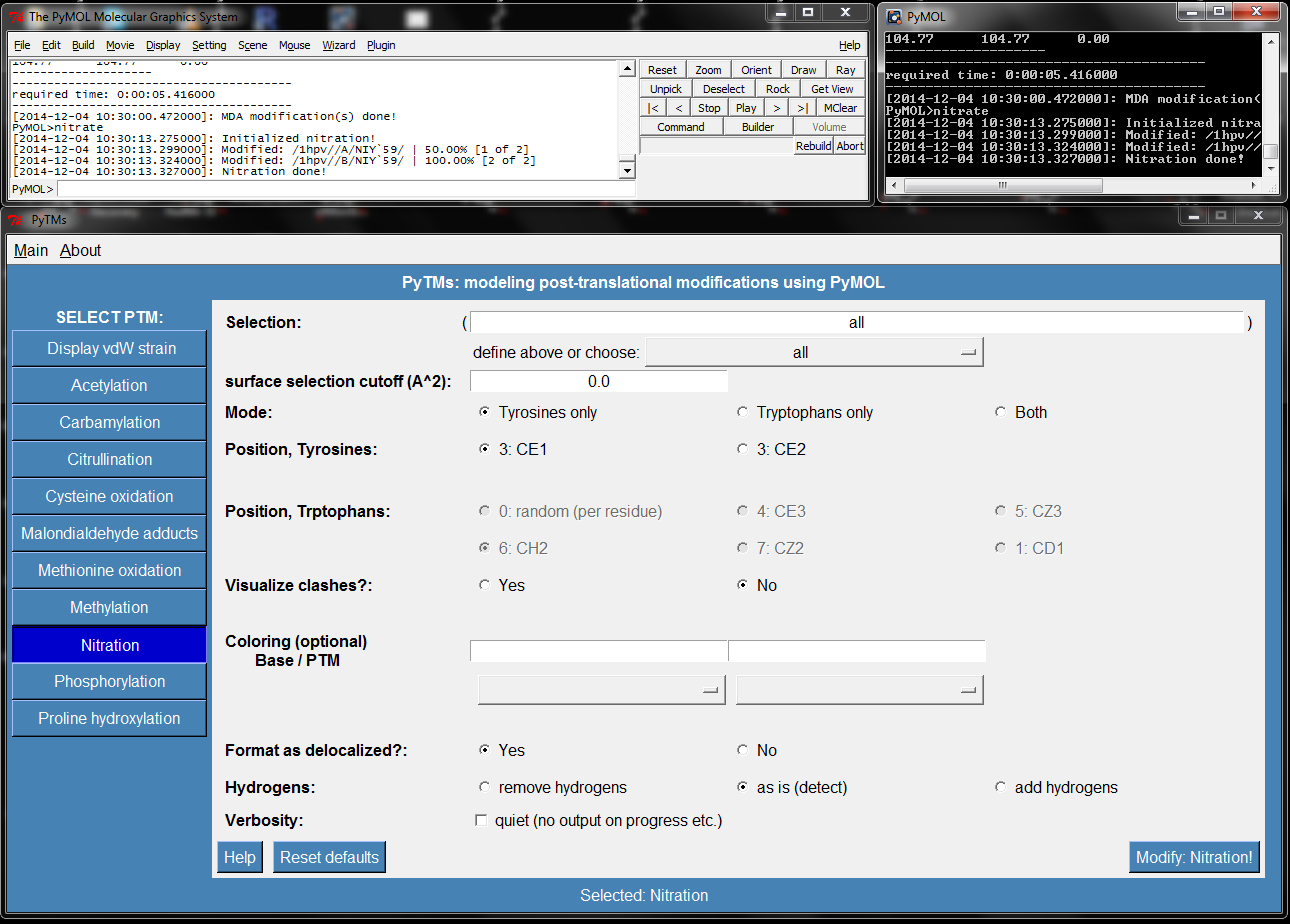
| 05:32, 4 December 2014 | Pytms menu.png (file) |  |
154 KB | Andwar | pytms menu example | 1 |
| 05:24, 4 December 2014 | Pytms optimization animation.gif (file) |  |
423 KB | Andwar | example of PyTMs animated optimization | 1 |
| 05:23, 4 December 2014 | Pytms.gif (file) |  |
329 KB | Andwar | examples of PTM-AA | 1 |
| 20:00, 23 October 2014 | Final molecule.png (file) |  |
131 KB | RobbieSikora | The product of Ctrl + J + Enter | 1 |
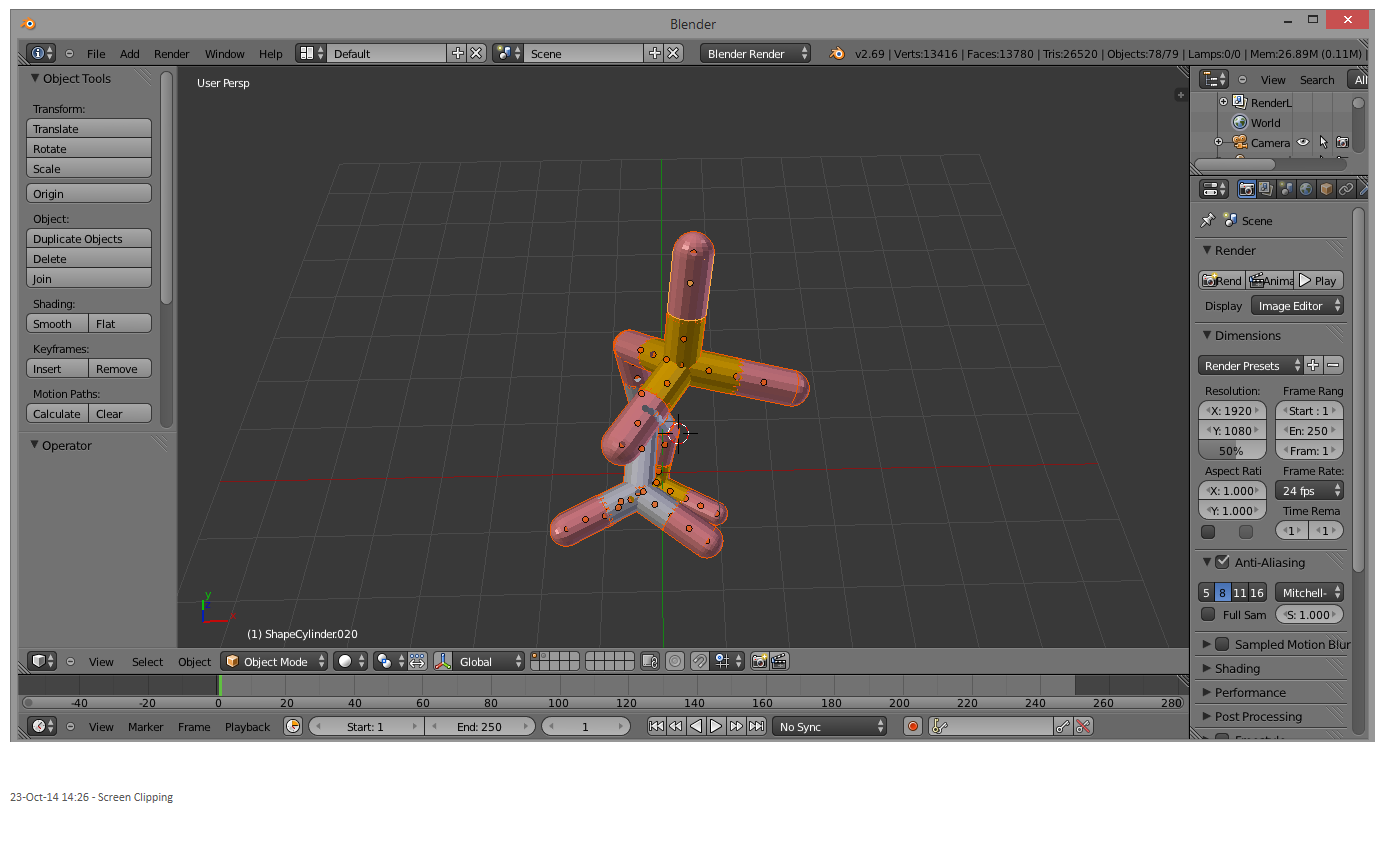
| 19:59, 23 October 2014 | Segregated molecule.png (file) |  |
139 KB | RobbieSikora | 1 |