Difference between revisions of "Forster distance calculator"
| Line 100: | Line 100: | ||
https://github.com/Pymol-Scripts/Pymol-script-repo/blob/master/forster_distance_calculator.py | https://github.com/Pymol-Scripts/Pymol-script-repo/blob/master/forster_distance_calculator.py | ||
See the raw code or download manually, by right clicking the following link here -> Save as: forster_distance_calculator.py | See the raw code or download manually, by right clicking the following link here -> Save as: forster_distance_calculator.py | ||
| − | https://raw.github.com/Pymol-Scripts/Pymol-script-repo/master/ | + | https://raw.github.com/Pymol-Scripts/Pymol-script-repo/master/forster_distance_calculator.py |
[[Category:Script_Library]] | [[Category:Script_Library]] | ||
[[Category:Biochemical_Scripts]] | [[Category:Biochemical_Scripts]] | ||
Revision as of 13:18, 1 December 2011
Author
This pymol script is made by Troels Emtekær Linnet
Introduction
This script can be handsome, if one is working with Förster resonance energy transfer in proteins. The script calculates the Förster distance: R0, from two dyes excitation/emission spectres.
This script is very handsome, if one want's to pick two dyes from different companies, and the Förster distance is not provided in a table.
This script does no calculation of proteins in pymol, but is made as a "hack/shortcut" for a python script.
We use the python part of pymol to do the calculations, so a student would not need to install python at home, but simply pymol.
Spectre input
There should be provided the path to four datafiles:
Excitation and Emission spectre for the Donor dye: D_Exi="path.txt" D_Emi="path.txt
Excitation and Emission spectre for the Acceptor dye: A_Exi="path.txt" A_Emi="path.txt
Each of the files shall be a two column file. Separated by space. Numbers are "." dot noted and not by "," comma. One can for example prepare the files by search-and-replace in a small text editor.
The first column is the wavelength in nanometers "nm" or centimetres "cm". Second column is the arbitrary units of excitation/emission.
For example:
Absorption
Wavelength "Alexa Fluor 488 H2O (AB)"

300.00 0.1949100000
301.00 0.1991200000
302.00 0.2045100000
303.00 0.2078800000
....
Getting spectres
For example provides the company ATTO-TEC spectre for their dyes in excel format Spectre(excel-file). These can easily be copied from excel to a flat two column file.
Some of the most cited dyes are the Alexa Fluor dyes from the company invitrogen. Invitrogen does not provide spectres for their dyes in dataformat, but as flat picture files.
Luckily, a group on University of Arizona have traced several spectre of dyes from the literature with a graphics program. They have made these spectre easily public at http://www.spectra.arizona.edu/. I highly recommend this homepage.
With these Spectra, the script can calculate the Forster Distance for different dyes from different companies.
Download one spectrum at the time by "deselecting" in the right side of the graph window. Then get the datafile with the button in the lower right corner.
Input values
The calculation needs input for:
- Qd: Fluorescence quantum yield of the donor in the absence of the acceptor.
- This is normally provided from the manufacture, and this information is normally also available in the database.
- It is recognized in the literature, that the value for Qd, changes on behalf on which position its located on the protein.
- Changes in 5-10 % is normal, but much larger values can be expected if the dye make hydrophobic interactions with the protein. This is dye-nature dependant.
- This value can only be determined precisely with experiments for the protein at hand.
- But anyway, for a "starting" selection for a FRET pair, the manufacture Qd should be "ok".
- Kappa2 = 2.0/3.0: Dipole orientation factor.
- In the literature, I often see this equal 2/3=0,667 This corresponds for free diffusing dye.
- For a dye attached to a protein, and restricted in one direction, the value is equal Kappa2=0.476
- But since we take the 6th root of the value, the difference ends up only being 5% in relative difference for the R0 value.
- Kappa2=2/3 can be a valid fast approximation, for the purpose of ordering dyes. But be careful and check the literature for discussions.
- n = 1.33:
- water=1.33, protein=1.4, n(2M GuHCl)=1.375
- Again, we take the sixth root, so the differences are "not so important".
How the script works
- The script integrate the Donor emission spectre, to divide with it.
- This is done by simple numerical integration by the Rectangle method
- All datapoints for the Acceptor excitation spectre are scaled, so that e(molar extinction coefficient) fits the wavelength where it is determined.
- For the multiplication of the spectre, the script test that both data points exist before multiplication.
- This can be troublesome, if there is 1-2 nm between each data point. Or if they are "un-even". Like Donor has 100.2 100.4 100.4 and Acceptor has 100.1 100.3 100.5
- But most spectre have much better resolution. Mostly 0.2 nm, and "even spaced"
- So this should work quite good as well.
The output is a text file, with all the datapoints.
- Column: Donor: The input Emission wavelength.
- Column: Donor: The input Emission, arbitrary units of excitation.
- Column: Donor: The input Emission, arbitrary units of excitation, divided by the integrated area.
- Column: Acceptor: The input excitation wavelength.
- Column: Acceptor: The input excitation e(molar extinction coefficient).
- Column: Acceptor: The input excitation e(molar extinction coefficient), scaled correctly.
- Column: The calculated overlap for this datapoint.
- Column: The summed values for calculated overlap, until this datapoint.
It also automatically generates a gnuplot .plt file, for super fast making graphs of the spectres. In linux, gnuplot is normally part of the installation. Just write: gnuplot FILENAME.plt
If you are in windows, download gnuplot and open the .plt file.
Gnuplot makes three graphs in .eps format. They can be converted to pdf with the program: epstopdf or eps2pdf. They are for example part of LaTeX: C:\Program Files (x86)\MiKTeX 2.9\miktex\bin or you can download it here. The format of .eps is choses, since gnuplot then allows for math symbols in the graphs.
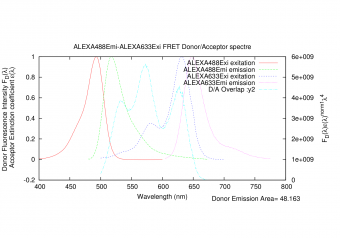
All graphs plotted together, but not scaled correctly.
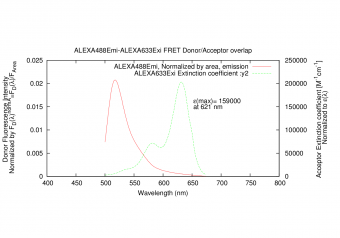
The Donor emission (y1) and Acceptor excitation (y2) scaled correctly.
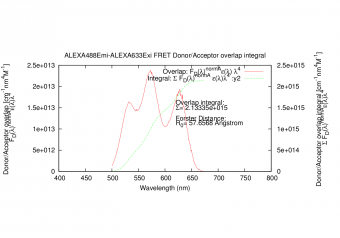
The Rectangle integral datapoint (y1) and the summed integration (y2).


How to run the script
Make a pymol .pml file like this. Write in the required information, and execute/run the script with pymol. Then open the .plt file afterwards with gnuplot.
## Change to your directory
cd /homes/YOU/Documents/Atto-dyes/Spectre/ALEXA488-ALEXA633
import forster_distance_calculator
forster D_Exi=ALEXA488Exi.txt, D_Emi=ALEXA488Emi.txt, A_Exi=ALEXA633Exi.txt, A_Emi=ALEXA633Emi.txt, A_e_Max_Y=159000, A_e_Max_X=621, Qd=0.92
Python Code
This code has been put under version control. In the project, Pymol-script-repo.
For a color coded view:
https://github.com/Pymol-Scripts/Pymol-script-repo/blob/master/forster_distance_calculator.py
See the raw code or download manually, by right clicking the following link here -> Save as: forster_distance_calculator.py
https://raw.github.com/Pymol-Scripts/Pymol-script-repo/master/forster_distance_calculator.py